


The US food vending machine market sits inside a convenience services industry that the NAMA Foundation and Technomic estimate at $31.1 billion in 2025. Vending machines alone produced about $18.2 billion in 2023, and global estimates run from $22.3 billion to $42 billion depending on the firm.
This guide gathers the most reliable vending machine industry statistics and food and beverage vending data in one place. Every number names its source, and the final sections explain what the data means when you choose a machine and why the big research firms disagree so widely.
Food Vending Machine Market Size At A Glance
The clearest picture of the US market comes from the NAMA industry census. NAMA is the National Automatic Merchandising Association, and its foundation runs the census with Technomic, a Chicago food industry research firm. The latest release, the 2024-25 State of Convenience Services, came out in March 2026. It puts total industry revenue at $31.1 billion in 2025, up from $26.6 billion in 2023, with average annual growth of 8.1% since 2023.
$31.1B
US convenience services revenue in 2025 (NAMA and Technomic)
$18.2B
US vending machine revenue in 2023, about 68% of the industry
78%
Share of vending sales paid cashless in 2025 (Cantaloupe)
22%
Share of micro market sales from fresh or prepared food (NAMA)
That $31.1 billion is wider than vending alone. It covers four business lines: traditional vending machines, micro markets, office coffee service and pantry services. Vending is still the biggest line by revenue and by number of businesses, and the 2024-25 release projects growth of about 6.5% a year across the whole industry in the years ahead. NAMA also reports that the industry employs more than 171,000 people and serves more than 40 million American consumers every day.
For anyone who sells, buys or runs a vending machine, the headline is simple and exciting. Demand for unattended food and drink is large, it is growing, and it is shifting toward fresh food, smarter cabinets and card payments.
Market Size Estimates By Year And Source
The table below lists every published estimate used in this guide, with the year it describes, what it measures and who produced it. Read the scope column first. A US convenience services total and a global machine market total are different numbers, and mixing them is the most common mistake in vending articles.
| Year | Estimate | What it measures | Source |
|---|---|---|---|
| 2019 | $26.6 billion | US convenience services (vending, micro markets, office coffee, pantry) | NAMA Foundation and Technomic, 2022-2023 Industry Census |
| 2020 | $15.6 billion | US convenience services in the pandemic year | NAMA Foundation and Technomic, 2022-2023 Industry Census |
| 2022 | $22.4 billion | US convenience services | NAMA Foundation and Technomic, 2022-2023 Industry Census |
| 2023 | $26.6 billion | US convenience services | NAMA Foundation and Technomic, 2022-2023 Industry Census |
| 2023 | $18.2 billion | US vending machines only | NAMA Foundation and Technomic, 2022-2023 Industry Census |
| 2025 | $31.1 billion | US convenience services | NAMA Foundation and Technomic, 2024-25 State of Convenience Services |
| 2025 | $3.3 billion | Food and beverage vending sales on one payment network | Cantaloupe, 2026 Micropayment Trends Report |
| 2021 | $18.3 billion | Global vending machine market | Allied Market Research |
| 2023 | $42.0 billion | Global vending machine market | Stellar Market Research |
| 2025 | $22.3 billion | Global vending machine market | IMARC Group |
| 2024 | $4.4 billion | Global hot food vending machine market | DataHorizzon Research |
| 2028 (forecast) | 54% above 2023 | US convenience services, including inflation | NAMA Foundation and Technomic, 2022-2023 Industry Census |
| 2032 (forecast) | $37.2 billion | Global vending machine market | Allied Market Research |
| 2034 (forecast) | $31.9 billion | Global vending machine market | IMARC Group |
Reading tip: When you quote a market size in a business plan or a pitch to a property manager, always name the year, the scope and the source together. "$18.2 billion in US vending revenue in 2023, NAMA census" is a strong sentence. "Vending is a $40 billion market" is not.
US Vending Machine Industry Statistics In Detail
The 2022-2023 NAMA census is still the most detailed public breakdown of the US market. It splits revenue by business line and tracks machines, operators and sales per machine across 2018, 2020 and 2023. The newer 2024-25 release updates the totals, while the detailed segment tables come from the 2022-2023 edition.
Revenue By Business Line
| Business line | 2019 revenue | 2019 share | 2023 revenue | 2023 share |
|---|---|---|---|---|
| Vending machines | $18.4 billion | 69% | $18.2 billion | 68% |
| Micro markets | $2.4 billion | 9% | $5.4 billion | 20% |
| Office coffee service | $5.1 billion | 19% | $2.6 billion | 10% |
| Pantry services | $0.6 billion | 2% | $0.4 billion | About 1.5% |
| Total | $26.6 billion | 100% | $26.6 billion | 100% |
The total looks flat, yet the mix underneath changed dramatically. Micro markets more than doubled. Office coffee fell by about half as remote work cut office traffic. Vending held almost exactly level, which means it climbed back from a 2020 low of $12.5 billion.
Vending Machines, Operators And Sales Per Machine
| Vending metric | 2018 | 2020 | 2023 |
|---|---|---|---|
| Total revenue | $18.5 billion | $12.5 billion | $18.2 billion |
| Vending operators | 12,785 | 11,850 | 10,450 |
| Machines in use | About 4.0 million | About 3.1 million | About 2.9 million |
| Machines per operator | 313 | 262 | 277 |
| Sales per machine per year | $4,678 | $4,032 | $6,284 |
This is the most useful table in the whole census for a buyer. The US now runs about a million fewer machines than in 2018, yet each machine earns about a third more. The census links that rise to higher prices per item, which operators say have climbed faster in recent years, and to cashless payment, which lifts the average spend. Fewer machines and higher sales per machine point to one clear lesson: placement quality and product mix matter more than machine count.
Manufacturing facilities are the most common location for both vending machines and micro markets, according to the census. Office buildings rank second for micro markets. Operators named manufacturing, hospitality and colleges as the strongest new opportunities for micro markets.
Food And Beverage Vending Statistics By Segment
Segment data is where vending articles most often go wrong, so this section names its sources with extra care. NAMA does not publish a national split of vending revenue between snacks, cold drinks and food. An article that gives a precise US snack share is quoting a different measure. The segment picture below combines the best named sources for each category.
Cold Drinks And Beverages
Beverages are the largest product type in every global estimate we found. Allied Market Research reports that beverage vending machines held more than three fifths of global revenue in 2022. IMARC Group puts beverage machines at about 54.3% of the global market in 2025. Consumption research points the same way. A Centers for Disease Control and Prevention study of NHANES dietary data from 2005 to 2014 found that soft drinks, fruit drinks and tea made up 40.9% of all calories adults got from vending machines.
Snacks And Confectionery
The same CDC study ranks the snack categories behind drinks. Candy supplied 9.9% of vending calories, salty grain snacks 9.2%, and cookies and potato chips 5.1% each. On a given day, 3.9% of US adults ate or drank something from a vending machine, which the researchers estimated at about 9.5 million people. A widely repeated split of snacks 33%, beverages 29% and coffee 24% is real, but the NAMA census reports it for pantry services inside offices, not for vending machines.
Hot Food
Hot food is a smaller but fast-moving segment. DataHorizzon Research values the global hot food vending machine market at $4.4 billion in 2024 and projects $9.4 billion by 2033, a compound annual growth rate of 8.5%, with North America holding about 43%. Allied Market Research also names food vending machines as the fastest-growing machine type in its forecast, at an 8.4% compound annual rate. VMFS runs hot food vending pilot programs in the US and invites new pilot sites, because sales data from a live site is the best way to prove a hot meal format.
Fresh And Frozen Food
The census gives one strong number for fresh food. Micro market operators report that about 22% of their sales come from fresh or prepared food and about 10% from frozen food. That is a powerful signal for operators, because it shows what consumers buy once a format can hold fresh meals safely. The census also notes that consumer demand for grab-and-go meals is opening new opportunities for vending operators.
Healthy And Better For You Items
- 53% of vending operators increased better for you offerings in the past year (NAMA 2022-2023 census).
- 65% of operators cite client requests for healthier product mixes, and 59% see better for you products as a growth opportunity (NAMA 2024-25 release).
- Operators adding healthier items describe them most often as low or no sugar (78%), low calorie (72%) and low fat (64%) products (NAMA census).
- In 2022, 23% of offerings in an average vending machine met the NAMA nutrition standard: 38% in beverage machines, 22% in mixed machines and only 8% in snack machines (Partnership for a Healthier America progress report).
The 8% figure for snack machines shows how much room there is for a healthier snack range. Our guide to healthy vending machine snacks covers which products sell and how to price them.
Micro Markets And Smart Coolers
Micro markets are the fastest-growing business line in the industry. They were 2% of convenience services revenue in 2014 and 20% in 2023, with revenue rising from $2.4 billion in 2019 to $5.4 billion in 2023. The census counts 76,250 micro market payment kiosks run by 2,625 operators, and it forecasts 18.9% compound annual growth from 2023 to 2028. On the Cantaloupe network, micro market sales reached $1.13 billion in 2025, up 13%, across 7,451 locations. The census notes that smart coolers are increasingly used to replace traditional vending banks, because they fit smaller sites.
Cashless Payments
| Cashless metric | Value | Source |
|---|---|---|
| US vending machines that accept cashless payment | About 75% in 2023, up from 69% in 2018 | NAMA census |
| Cashless machines that accept contactless | 88% | NAMA census |
| Share of vending sales paid cashless | 78% in 2025, up from 73% in 2024 | Cantaloupe 2026 report |
| Average cashless vending ticket | $2.45, against $1.57 for cash | Cantaloupe 2026 report |
| Contactless share of cashless vending sales | 85% in 2025, up from 78% | Cantaloupe 2026 report |
| Average ticket by format | Vending $2.01, micro market $3.02, smart store $4.49 | Cantaloupe 2026 report |
A cashless ticket that runs 59% above a cash ticket is one of the most practical statistics in this guide. It explains why a card reader can quickly cover its monthly fee at a busy site.
US Versus Global Food Vending Statistics
North America leads the global market in the Allied, IMARC and Stellar reports, but the global numbers are far less consistent than the US census. This comparison sets the two side by side.
| Metric | United States | Global |
|---|---|---|
| Market size | $31.1 billion convenience services in 2025; $18.2 billion vending in 2023 (NAMA) | $22.3 billion in 2025 (IMARC) to $42.0 billion in 2023 (Stellar) |
| Regional weight | The US holds more than 75.5% of the North American market (IMARC) | North America held more than 28.5% in 2025 (IMARC) and more than one third in 2022 (Allied) |
| Installed machines | About 2.89 million vending machines in 2023 (NAMA) | Japan alone has about 2.2 million beverage machines (Japan Vending System Manufacturers Association) |
| Forecast growth | Vending 4.8% a year, whole industry 8.9% a year, 2023 to 2028 (NAMA 2022-2023 census) | 3.94% a year to 2034 (IMARC); 7.5% to 2032 (Allied); 8.1% to 2030 (Stellar) |
| Beverage share | Not published by NAMA | About 54.3% (IMARC) to more than 60% (Allied) |
Japan is a useful contrast. The Japan Vending System Manufacturers Association reports about 2.2 million beverage vending machines, 23% below the 1985 peak, and beverage vending volume fell from 72 million cases in 1997 to 42 million in 2024, as reported by Vending Times in March 2026. The most mature machine market in the world is shrinking in unit terms. The US story is different. Machine counts are falling here too, but sales per machine are rising and fresh food formats are growing fast.
Growth Drivers Behind The Numbers
Cashless lifts every ticket
Card and phone payments raise spend per sale. Cashless tickets average $2.45 against $1.57 in cash on the Cantaloupe network.
Food away from home keeps rising
USDA Economic Research Service data shows 56.3% of US food spending went to food away from home in 2025, and per capita spending hit a record $3,936.
Smart cabinets reach new sites
Micro markets and smart coolers fit smaller footprints. NAMA expects micro markets to grow 18.9% a year through 2028.
Clients ask for healthier mixes
65% of operators hear client requests for healthier food, and fresh items sell where the cabinet can hold them.
Higher prices per item
The census links the jump to $6,284 in sales per machine to faster per-item price growth and cashless spend.
A leaner, stronger operator base
Operators fell from 12,785 in 2018 to 10,450 in 2023 while revenue recovered, so each remaining operator runs a larger business.
Workplace patterns matter too. The census assumes that a full five-day return to the office is unlikely, which keeps office coffee below its 2019 level. Factories, hospitals and college campuses have people on site every day, which is why manufacturing leads the census location data and colleges rank among the strongest new opportunities. VPlaced ranks these site types in its guide to the best places for a food vending machine.
What The Numbers Mean When You Choose A Machine
Market statistics are only useful when they change a decision. Here is how each trend translates into a machine choice for a US operator, using live VMFS catalog prices.
| What the data shows | What it means for your machine | VMFS options |
|---|---|---|
| Cashless tickets run 59% higher than cash | Add a card reader to every machine at a busy site | Card readers are optional add-ons, and every machine supports QR code payments |
| 22% of micro market sales are fresh or prepared food | Fresh meals need a refrigerated cabinet with secure access | AI Grab and Go Cooler $2,950; AI Smart Fridge $9,950 to $12,650 |
| Allied Market Research names food machines the fastest-growing machine type | Hot meals work where cafeterias close early or never existed | Mini Hot Food $12,450; Hot Foods $14,450; Lunch Box $14,450; Ramen Noodle $9,950 |
| Fresh and fragile items need gentle delivery | Use an elevator delivery system instead of a spiral drop | Food Elevator Vending Machine $8,950 |
| Only 8% of snack machine offerings met the NAMA standard | A snack machine with a healthier mix stands out to wellness clients | Build Your Snack Vending Machine from $3,595; Countertop Snack $1,900 |
| 10% of micro market sales are frozen food | Frozen meals and ice cream need a dedicated freezer cabinet | Frozen Ice Cream Vending Machine $9,950 |
If the fresh food data fits your sites, compare the full range of food vending machines side by side. Operators who want a specific temperature, delivery type and tray layout can configure a food vending machine from $9,750. For open-door fresh retail, smart vending machines bring the micro market format into a single cabinet.
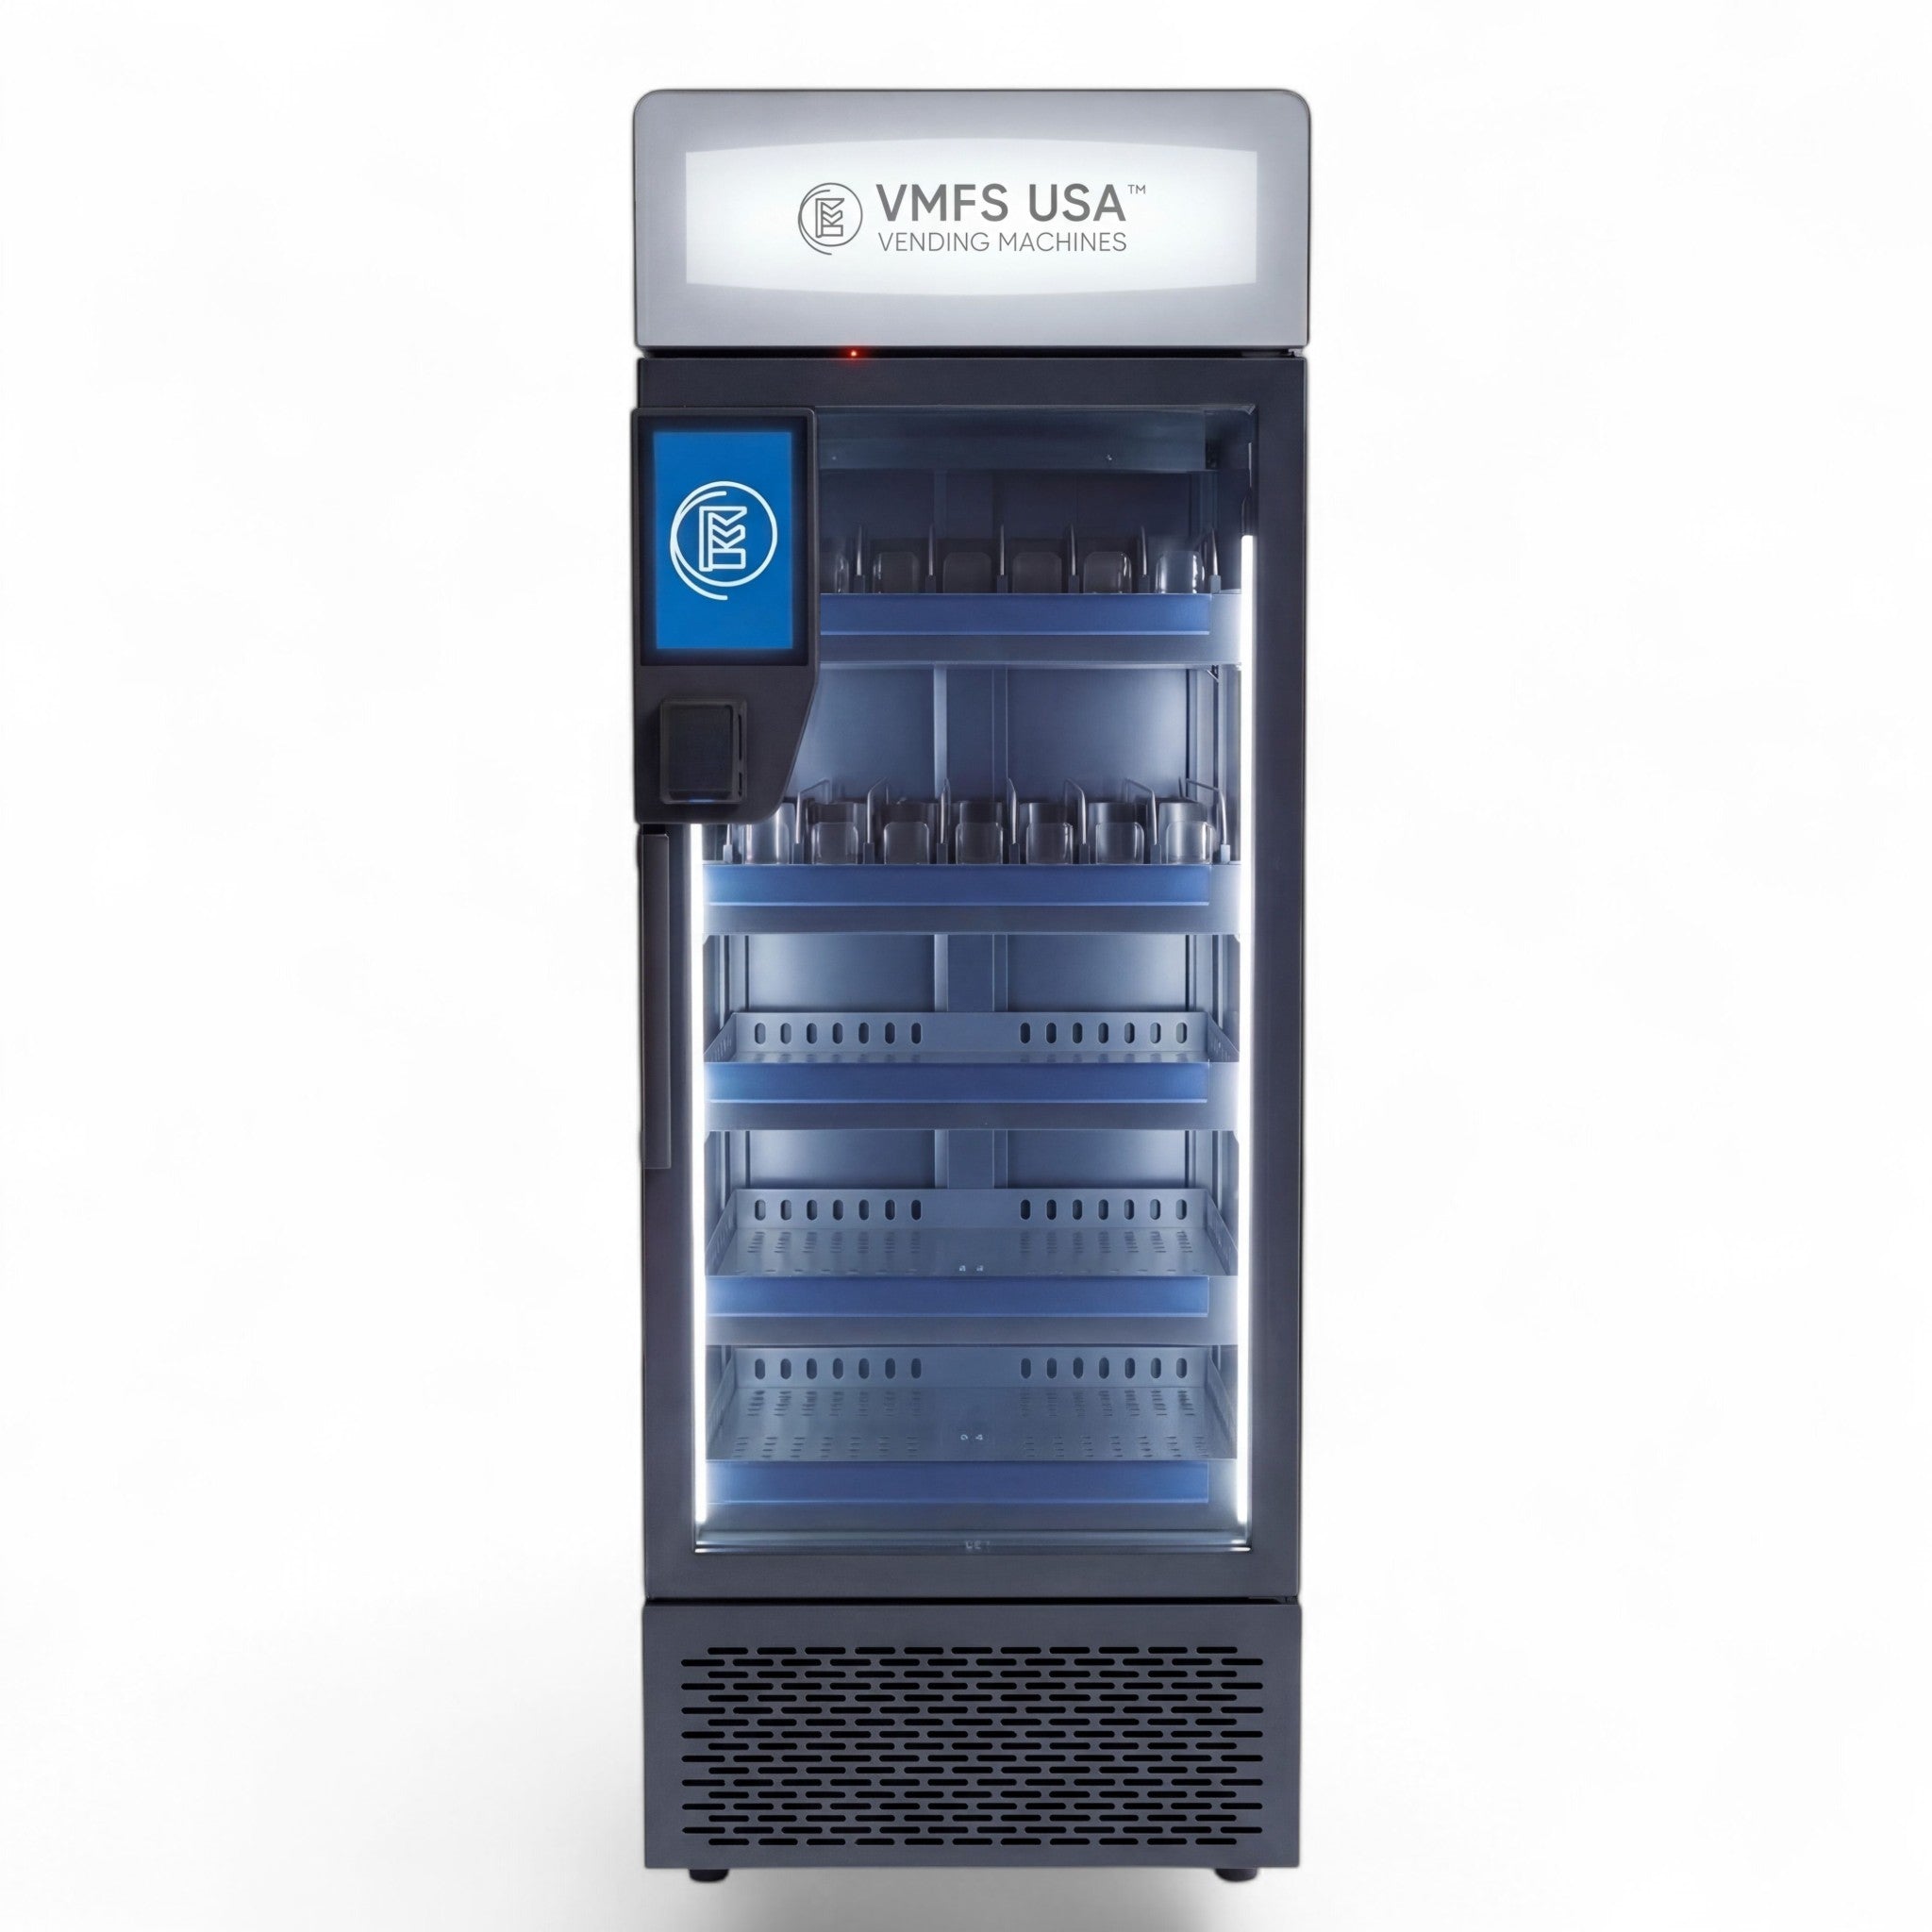
For hot meals, the Mini Hot Food Vending Machine combines refrigerated storage with microwave heating in a compact footprint. The Food Elevator Vending Machine uses an elevator to deliver fragile fresh items instead of dropping them, and frozen meals belong in frozen vending machines.
Payment hardware deserves the same attention as the cabinet. Vending machines with card readers capture the higher cashless ticket. Card reader operating fees run roughly $7.95 to $9.99 a month and include a SIM, so the machine does not need store internet. VMFS Cloud is an optional paid add-on from $7.99 a month that reports sales, stock and alerts, which turns the statistics in this guide into your own machine-level data.
A data checklist before you buy
- ✓Name the segment you are entering: snacks, cold drinks, fresh food, hot food or frozen.
- ✓Match the cabinet to the food: ambient, refrigerated, frozen or heated.
- ✓Plan card payments from day one, because cashless sales now lead.
- ✓Confirm local health rules for perishable food before you order.
- ✓Check the site's daily population and hours, not only its foot traffic.
- ✓Budget for monitoring so you can measure sales per machine against the $6,284 census average.
Perishable food brings rules that snack machines do not face. Before you commit to a fresh or hot meal format, review the food safety rules for a food vending machine, which cover holding temperatures for hot and cold food and the permits a food machine needs.
Fresh food sells on repeat visits, so promotion matters after the machine is installed. A clear plan to market a food vending business helps turn first buyers into daily regulars. It also helps to list your machines on VendingFinder, so people nearby can find your location when they search for food or drinks.
Turn The Market Data Into A Machine
Compare refrigerated, frozen and hot meal formats with live prices and financing through PayPal, Klarna and ClickLease.
Shop Vending Machines For Sale →How Market Size Estimates Differ Between Firms
A global estimate of $22.3 billion for 2025 and another of $42.0 billion for 2023 cannot both describe the same thing. They differ because each firm makes different choices. Understanding those choices protects you from building a plan on the wrong number.
- Scope. NAMA measures US convenience services, which includes micro markets, office coffee and pantry. Global firms measure a "vending machine market" across all countries. These are different populations.
- What is counted. Public report summaries often do not say whether a figure counts the sale of machines, the sales of products through machines, or both. Two firms can study the same industry and count different money.
- Machine types. Some reports include tobacco and other non-food machines alongside food and beverage. Others, like the Technavio study of vending machine food and beverages, cover a narrower slice. Technavio forecasts that slice to grow by $1.27 billion from 2023 to 2028, at a 4.5% compound annual rate.
- Base year and inflation. Reports start from different base years and forecast to different end years. NAMA states that its forecast of 54% growth from 2023 to 2028 includes inflation as well as real growth.
- Sample and error. The NAMA census combines an operator survey, interviews and Technomic foodservice data. Its 2022-2023 edition gives an error margin of plus or minus 5%, and participants in the 2024-25 edition represent about 27% of industry activity.
- Network data. Cantaloupe reports transactions on its own payment devices, about 621,000 in the 2026 edition. These figures are excellent for behavior, such as ticket size and payment mix, but they cover one network, not the whole market.
- Restatements. Network figures can change between editions. Cantaloupe's 2025 report showed $3.5 billion in food and beverage vending sales for 2024 and a 71% cashless share. Its 2026 report shows $3.3 billion for 2025 with 5% growth, and restates the 2024 cashless share as 73%, which suggests the underlying data set changed.
How to use the numbers: Use the NAMA census for US market size, segment mix and machine counts. Use Cantaloupe data for payment behavior and ticket size. Use global research firms for direction and regional comparison only, and always quote the year and scope beside the figure.
With the numbers in context, the next step is matching a format to your sites. Compare vending machines for sale across snack, drink, fresh, frozen and hot food formats with live prices. In stock units ship in 7 to 21 days.
Related Reading
- The Future of Vending Machines: 2026 Industry Trends for Operators
- What is Food Vending? The Complete Guide to Automated Food Retail
- How Much Does a Food Vending Machine Cost?
- Micro Markets vs Vending Machines
- Best Selling Vending Machine Items: What Sells Best and Why
- AI Vending Machine Market Size
Frequently Asked Questions
Sources
- NAMA Foundation and Technomic: 2022-2023 Industry Census, The State of Convenience Services
- Cantaloupe: Micropayment Trends Report 2026
- USDA Economic Research Service: Food Service Industry Market Segments
- Onufrak et al., American Journal of Health Promotion (2019): Foods Consumed by US Adults from Non-School Cafeterias and Vending Machines, NHANES 2005-2014
Compartir:
Vending Machines for Sale Under $500: What to Expect
ZYN Vending Machine Cost: Price, Add-Ons, Stocking and Payback