




Design the perfect vending solution for your location and customers.

Join the VMFS newsletter and step into a thriving network dedicated to collective success.
One signup. Endless possibilities.
Ask what sells best in a vending machine and you get the same four answers everywhere: water, chips, candy, soda. That list is correct and nearly useless, because it tells you what people pick up and nothing about what pays you.
It is also built on a category split most operators still quote from memory, and the memory is fifteen years out of date.
This guide works from the current industry data on category share, adds the wholesale-to-retail economics that decide your actual margin, and finishes with the planogram, the shelf life, and the federal rules that govern what you can legally sell in regulated sites. If you are still choosing hardware, the full range of vending machines for sale covers every format discussed here.
The most commonly repeated statistic in vending is that cold drinks are somewhere north of half of all sales. That figure traces back to 2009 and 2010 era market data, when packaged cold beverages sat around 54 percent. It has not been true for a long time.
The NAMA Foundation runs an industry census every two years with the research firm Technomic. Its category breakdown puts the picture closer to snacks at 33 percent, beverages at 29 percent, and coffee at 24 percent, with the remainder spread across other categories.
Coffee is the number that surprises people. A quarter of convenience services revenue now sits in a category many small operators ignore entirely, which is part of why dedicated coffee vending machines have grown faster than almost any other format, and why ready to drink coffee has become a fixture in drinks vending machines that used to be soda-led.
What this means for your planogram: snacks and beverages are close to parity, not two to one in favour of drinks. If you have been under-facing snacks on the assumption that drinks carry the machine, the data no longer supports it. Coffee is the genuinely under-served category.
Scale matters for context too. There are roughly 4.6 million vending machines operating in the United States across more than 17,000 operator businesses, which is a mature market where product selection is one of the few remaining levers an independent operator fully controls.
Plenty of items that sell well in a store fail behind glass, and the failures are predictable.
A note on where these numbers come from, because it matters. Category share and compliance data below are published industry figures and attributed as such. The margin table is not published anywhere credible. It reflects operator-level wholesale-to-retail economics, and we are presenting it as VMFS operator knowledge rather than dressing it up as research.
Every figure assumes wholesale or club store purchasing. Buy at grocery retail and each one roughly halves.
| Category | Wholesale | Vending retail | Gross margin |
|---|---|---|---|
| Bottled water | $0.35 to $0.50 | $1.50 to $2.50 | 70 to 80 percent |
| Granola bars | $0.35 to $0.55 | $1.25 to $1.75 | 65 to 70 percent |
| Chips and pretzels | $0.35 to $0.55 | $1.25 to $1.75 | 60 to 70 percent |
| Cookies and crackers | $0.50 to $0.75 | $1.50 to $2.00 | 60 to 65 percent |
| Nuts and trail mix | $0.70 to $1.10 | $2.00 to $2.75 | 60 to 65 percent |
| Sports drinks | $0.90 to $1.20 | $2.25 to $3.00 | 55 to 60 percent |
| Soda, 20oz | $0.85 to $1.10 | $2.00 to $2.75 | 55 to 60 percent |
| Protein bars | $1.10 to $1.60 | $2.75 to $4.00 | 55 to 60 percent |
| Candy and chocolate | $0.75 to $1.00 | $1.75 to $2.25 | 50 to 58 percent |
| Jerky and meat snacks | $1.50 to $2.25 | $3.50 to $4.75 | 52 to 58 percent |
| Ready to drink coffee | $1.40 to $1.90 | $3.00 to $4.00 | 50 to 55 percent |
| Energy drinks | $1.60 to $2.10 | $3.00 to $4.00 | 45 to 50 percent |
The most useful single fact in vending: bottled water is both the highest volume item and the highest margin item in a typical cabinet. Nothing else does both. If your water facings run empty between visits, you are losing your best product at your best margin, which is why tracking margin per item alongside ROI per machine beats watching category totals.
Energy drinks are the instructive counterexample. They are routinely a top three seller by unit and close to the worst margin percentage in the machine, because wholesale cost is high and there is a hard ceiling on what people will pay. They earn their slots on gross dollars per vend rather than on percentage, which is a distinction category-level reporting hides completely.
Even at 29 percent of category revenue rather than the 55 percent operators often assume, beverages remain the most reliable performer per slot, because thirst is a daily repeating need while hunger is occasional.
Water is the safe purchase. No guilt, no dietary objection, no unfamiliarity risk, no strong flavour preference to get wrong. It is also the item customers accept a convenience premium on most readily, because the comparison price in their head is a vending price rather than a supermarket one.
Give it two facings minimum and three at a high traffic site. Running out of water is the most expensive stockout in vending and also the most common, which is the strongest practical argument for telemetry on a small route: VMFS Cloud reports sales by product at $7.99 a month, and pairing that with a sensible restock schedule stops the highest margin slot in the machine from sitting empty.
At busy sites the chilled column empties first regardless of how you weight it, which is why dedicated beverage capacity outperforms a compromise cabinet. Where space allows only one machine, combo vending machines carry both categories from one footprint, one outlet and one agreement.
At 33 percent of category revenue, snacks are the largest single category in the current NAMA data, and they are also where nearly all the waste happens because shelf life is shorter and preference is narrower.
Chips, chocolate bars and cookies sell everywhere because recognition removes hesitation, and hesitation is what kills a vending sale. Chips carry the best margin of the three at 60 to 70 percent. Chocolate carries the worst at 50 to 58 percent, and it has a temperature problem covered below.
Granola and protein bars have moved from niche to core. Granola bars quietly carry one of the best margins in the whole machine at 65 to 70 percent, behind only water. Protein bars sell at a much higher price point with a slightly lower percentage, meaning more gross dollars per vend, and in offices, gyms and healthcare they frequently outsell candy outright.
A machine loaded entirely with salty or entirely with sweet loses a share of every passing customer. Aim for roughly 40 percent salty, 30 percent sweet, 30 percent filling or neutral. That third bucket is the one most operators under-weight, and it is also where the margin is.
Presentation matters as much as selection. Dedicated snack vending machines give better visibility and fewer vend failures than cramming food into a drinks-first cabinet, and the facing and rotation mechanics are covered in our guide to loading and stocking a vending machine.
| Category | Typical shelf life | Write-off risk |
|---|---|---|
| Bottled water | 12 to 24 months | Effectively none |
| Jerky and meat snacks | Around 12 months | Very low |
| Protein and granola bars | 9 to 12 months | Low |
| Candy and chocolate | 6 to 12 months | Low, heat sensitive |
| Regular soda | 6 to 9 months | Low |
| Diet and zero sugar soda | 3 to 4 months | Moderate, sweetener degrades |
| Cookies and crackers | 4 to 6 months | Moderate |
| Chips and pretzels | 8 to 10 weeks | High |
| Pastries and baked goods | 4 to 8 weeks | Highest |
The two shortest-life categories are the two most commonly over-stocked. Diet soda is the quiet one, carrying roughly half the life of regular because the sweetener degrades, and a flat-tasting diet drink loses that customer permanently rather than for one purchase.
Hold yourself to write-offs under 3 percent of stock value. Above 5 percent you are over-facing short-life categories rather than picking wrong products, and the fix is fewer chip and pastry facings rather than a different brand. If the initial fill is what is straining cash rather than the waste, what it costs to stock a machine and where to buy at wholesale cover that side.
A product that will not vend costs you twice: the refund, and the customer who stops using the machine.
Two of these are solved by hardware rather than by product choice. Fragile items, glass bottles and premium packaging that will not survive a drop belong in elevator vending machines, which lower the item rather than dropping it, and coil pitch itself is a consumable you can change: matching spiral pitch to package width using the right vending machine parts and accessories fixes more jams than switching brands ever will.
The heat problem is a siting decision. If the machine lives on a loading dock, a forecourt or anywhere without climate control, chocolate should come out of the planogram entirely and the cabinet itself should be rated for it, which is what separates outdoor vending machines from an indoor unit someone pushed under an awning.
This is where published data gets genuinely interesting, because it shows a gap almost every operator is sitting on without realising.
NAMA runs a voluntary better-for-you commitment with the Partnership for a Healthier America, and the verified results are blunt. Across participating operators, only about **23 percent** of offerings in an average vending machine meet the NAMA nutrition standard. That figure has stayed broadly flat since the 2019 baseline of 24 percent, despite a stated commitment to reach 33 percent.
The split by machine type is the part worth acting on:
| Machine type | Share of offerings meeting the NAMA standard |
|---|---|
| Beverage only | 38 percent |
| Mixed snack and drink | 22 percent |
| Snack only | 8 percent |
Eight percent. In a typical snack-only machine, roughly one selection in twelve qualifies as better-for-you, and that number has not moved in years across the reporting operator base.
Why this is a commercial opportunity rather than a lecture: the margin data says better-for-you items are not a sacrifice. Granola bars run 65 to 70 percent and nuts 60 to 65 percent, both ahead of candy at 50 to 58 percent. An operator moving a snack machine from 8 percent compliant to 25 percent is very likely raising blended margin, not lowering it, while becoming eligible for corporate and healthcare sites that screen on exactly this.
That eligibility point is the real prize. Corporate wellness programmes, hospitals and clinics increasingly ask what proportion of your offering meets a recognised standard before they sign. Healthy vending machines configured for those sites answer the question before it is asked, and vending machine placement in the VMFS network prioritises exactly these venue types.
What does not work is going all in. Strip every classic snack and total sales usually fall, because you remove the impulse purchase that funds the machine. A mixed set lets the customer choose by mood, which is also the finding in our own analysis of whether vending machines are profitable.
Since the 2014 to 2015 school year, USDA Smart Snacks in School standards have governed every food and beverage sold to students during the school day on a US school campus. These are competitive foods under federal regulation at 7 CFR 210.11, and vending machines are explicitly covered.
Before any nutrient limit applies, a snack must be a whole grain rich product, or have a fruit, vegetable, dairy product or protein food as its first ingredient, or be a combination food containing at least a quarter cup of fruit or vegetable.
| Limit | Snack items | Entrée items |
|---|---|---|
| Calories | 200 or fewer | 350 or fewer |
| Sodium | 200mg or less | 480mg or less |
| Total fat | 35 percent of calories or less | Same |
| Saturated fat | Under 10 percent of calories | Same |
| Trans fat | Zero grams | Same |
| Total sugars | 35 percent of weight or less | Same |
Run the standard bestseller list against that table and most of it fails. Regular potato chips exceed the sodium and fat limits. Standard chocolate bars exceed calories and sugar. Full sugar soda is not permitted at all.
Compliant school vending typically means baked chips, whole grain crackers, reduced sodium popcorn, low sugar granola bars, dried fruit with no added sweetener, portioned nuts and seeds, and string cheese. On beverages, elementary and middle schools are generally limited to plain water, low fat and fat free milk, and 100 percent juice within size limits, while high schools may add certain lower calorie options.
Three details that catch operators out. The rules apply during the school day only, so after-hours access is treated differently. They apply to sales to students, not to staff, which is why faculty lounge machines follow separate rules. And states and districts may set stricter standards than the federal floor, so meeting Smart Snacks does not guarantee local compliance.
USDA publishes a Smart Snacks product calculator for checking individual items, and it is worth running every SKU through it before a school placement rather than after an audit. Where state or district rules layer on top, VAdviced covers vending compliance and licensing as a paid service in the network.
| Location | Lead category | Weight toward | Price tolerance |
|---|---|---|---|
| Offices | Water and coffee | Bars, lighter snacks, zero sugar | Moderate to high |
| Factories and warehouses | Sports and energy drinks | Filling snacks, jerky, larger portions | Low to moderate |
| Hospitals and clinics | Water and coffee | Protein bars, nuts, neutral snacks | High, 24 hour demand |
| Gyms and studios | Protein shakes and electrolytes | Bars, premium water, pre-workout | Highest of any site |
| Apartment buildings | Soda and water | Classic snacks, evening skew | Moderate |
| Car washes and laundromats | Soda and water | Chips, gum, low price points | Lowest |
| Schools, K to 12 | Water | Federally restricted, see above | Low |
Gyms are the outlier and deserve their own planogram, since average ticket runs roughly double an office at $4.00 to $5.00. The full breakdown sits in gym vending machines, and qualifying any site before you build a planogram is covered in best vending locations.
The bottom two rows deserve a note on format as well as product. Salons, laundromats, car washes and small offices rarely justify a full cabinet, and forcing one in means carrying 300 items where 90 would turn faster. Mini vending machines keep the SKU count honest at those sites, and where the room has no floor to give at all, wall mount vending machines open placements a standard cabinet cannot physically take.
This matters for product selection specifically because a smaller cabinet forces the 80/20 discipline on you. With 8 to 12 selections rather than 40, there is no room for a slow mover to hide, which is why compact sites often post better sell-through per slot than the large machine down the road.
In a typical machine, roughly the top 20 percent of SKUs generate 70 to 80 percent of sales. Most of your slots are doing very little, and the instinctive response is to add variety when the correct response is more facings of what already works.
Two operational rules follow. Any item with zero sales across two consecutive service visits is dead, so replace it rather than waiting. Any item selling out before every visit needs a second facing rather than a price increase.
None of this works without product level data, which is the strongest argument for telemetry on a small route regardless of machine tier.
Format changes the ceiling here too. In a coil machine, one customer is one item, so your only lever is which item they pick. AI grab and go vending machines remove that constraint entirely, because someone with an open door in front of them will take a drink and a bar without thinking about a second transaction, which lifts basket size in a way no planogram tweak can.
Trending items belong in the machine as a controlled experiment rather than as inventory. Cap them at roughly 10 percent of slots.
Worth testing: keto and low carb snacks, plant based jerky, sugar free candy and drinks, functional and sparkling beverages, spicy or global snack formats. Give each one exactly two service cycles. Sold through earns a permanent slot, moved a little earns one more cycle at eye level, nothing means out with no sentiment attached.
For the wider field of non-standard categories and formats, our guide to vending machine ideas goes considerably broader than snacks and drinks.
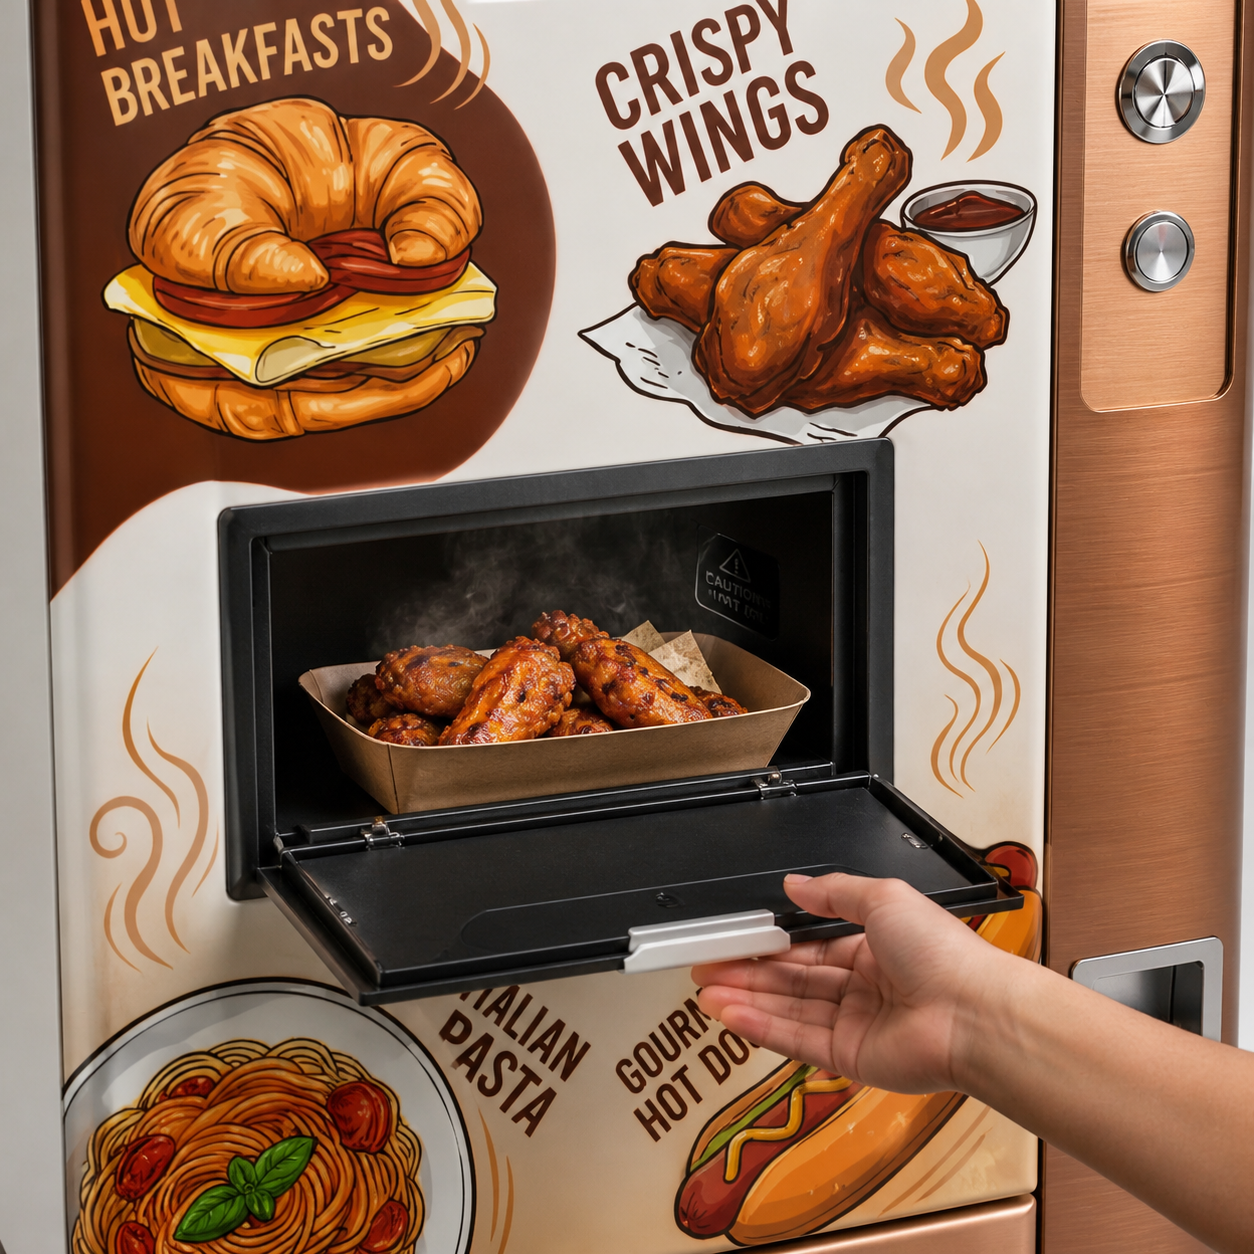
Some categories are a hardware decision rather than a slot test. Fresh meals, salads and sandwiches need refrigeration and short-cycle rotation, which is what food vending machines are built for, while ice cream and frozen meals need sub-freezing capability that no ambient cabinet can fake. If a site is asking for those categories, the answer is frozen vending machines rather than squeezing them into a snack planogram and writing off the waste.
Two or three price bands, not a unique price per slot. Decision speed matters and pricing complexity slows it.
Price for convenience rather than against a grocery store. Nobody standing in front of a machine at 3pm is comparing against a supermarket shelf, because there is no alternative within reach. Put the two highest performers at eye level, group by need rather than brand, and adjust by location: a gym absorbs $5.00 for a protein shake without hesitation while a laundromat resists $2.00 for a soda.
How easily you can change a price decides whether any of this happens in practice. On a coil machine every adjustment means relabelling each affected selection by hand, which is why so many machines quietly run on prices set two years ago. Touch screen smart vending machines make pricing software rather than stickers, so a seasonal change takes minutes across the whole route instead of a service visit per site.
Payment method also moves your ceiling. Customers reach a higher price point more comfortably when they tap than when they count coins, which is a large part of why premium water and protein bars price well and why vending machines with card readers tend to post higher average tickets on an identical planogram.
One change at a time is the discipline that makes the data readable. Change five things at once and you learn nothing about any of them.
What sells has barely changed in twenty years. What has changed is the category split, which is now close to parity between snacks and drinks with coffee taking a quarter, and the standard corporate and healthcare sites screen against before they sign.
Buy at wholesale so the margins hold, weight facings toward the top 20 percent, keep short shelf life categories tight, match the set to the location, and stay legal in regulated sites. Do those five things and an ordinary product list beats a clever one every time.
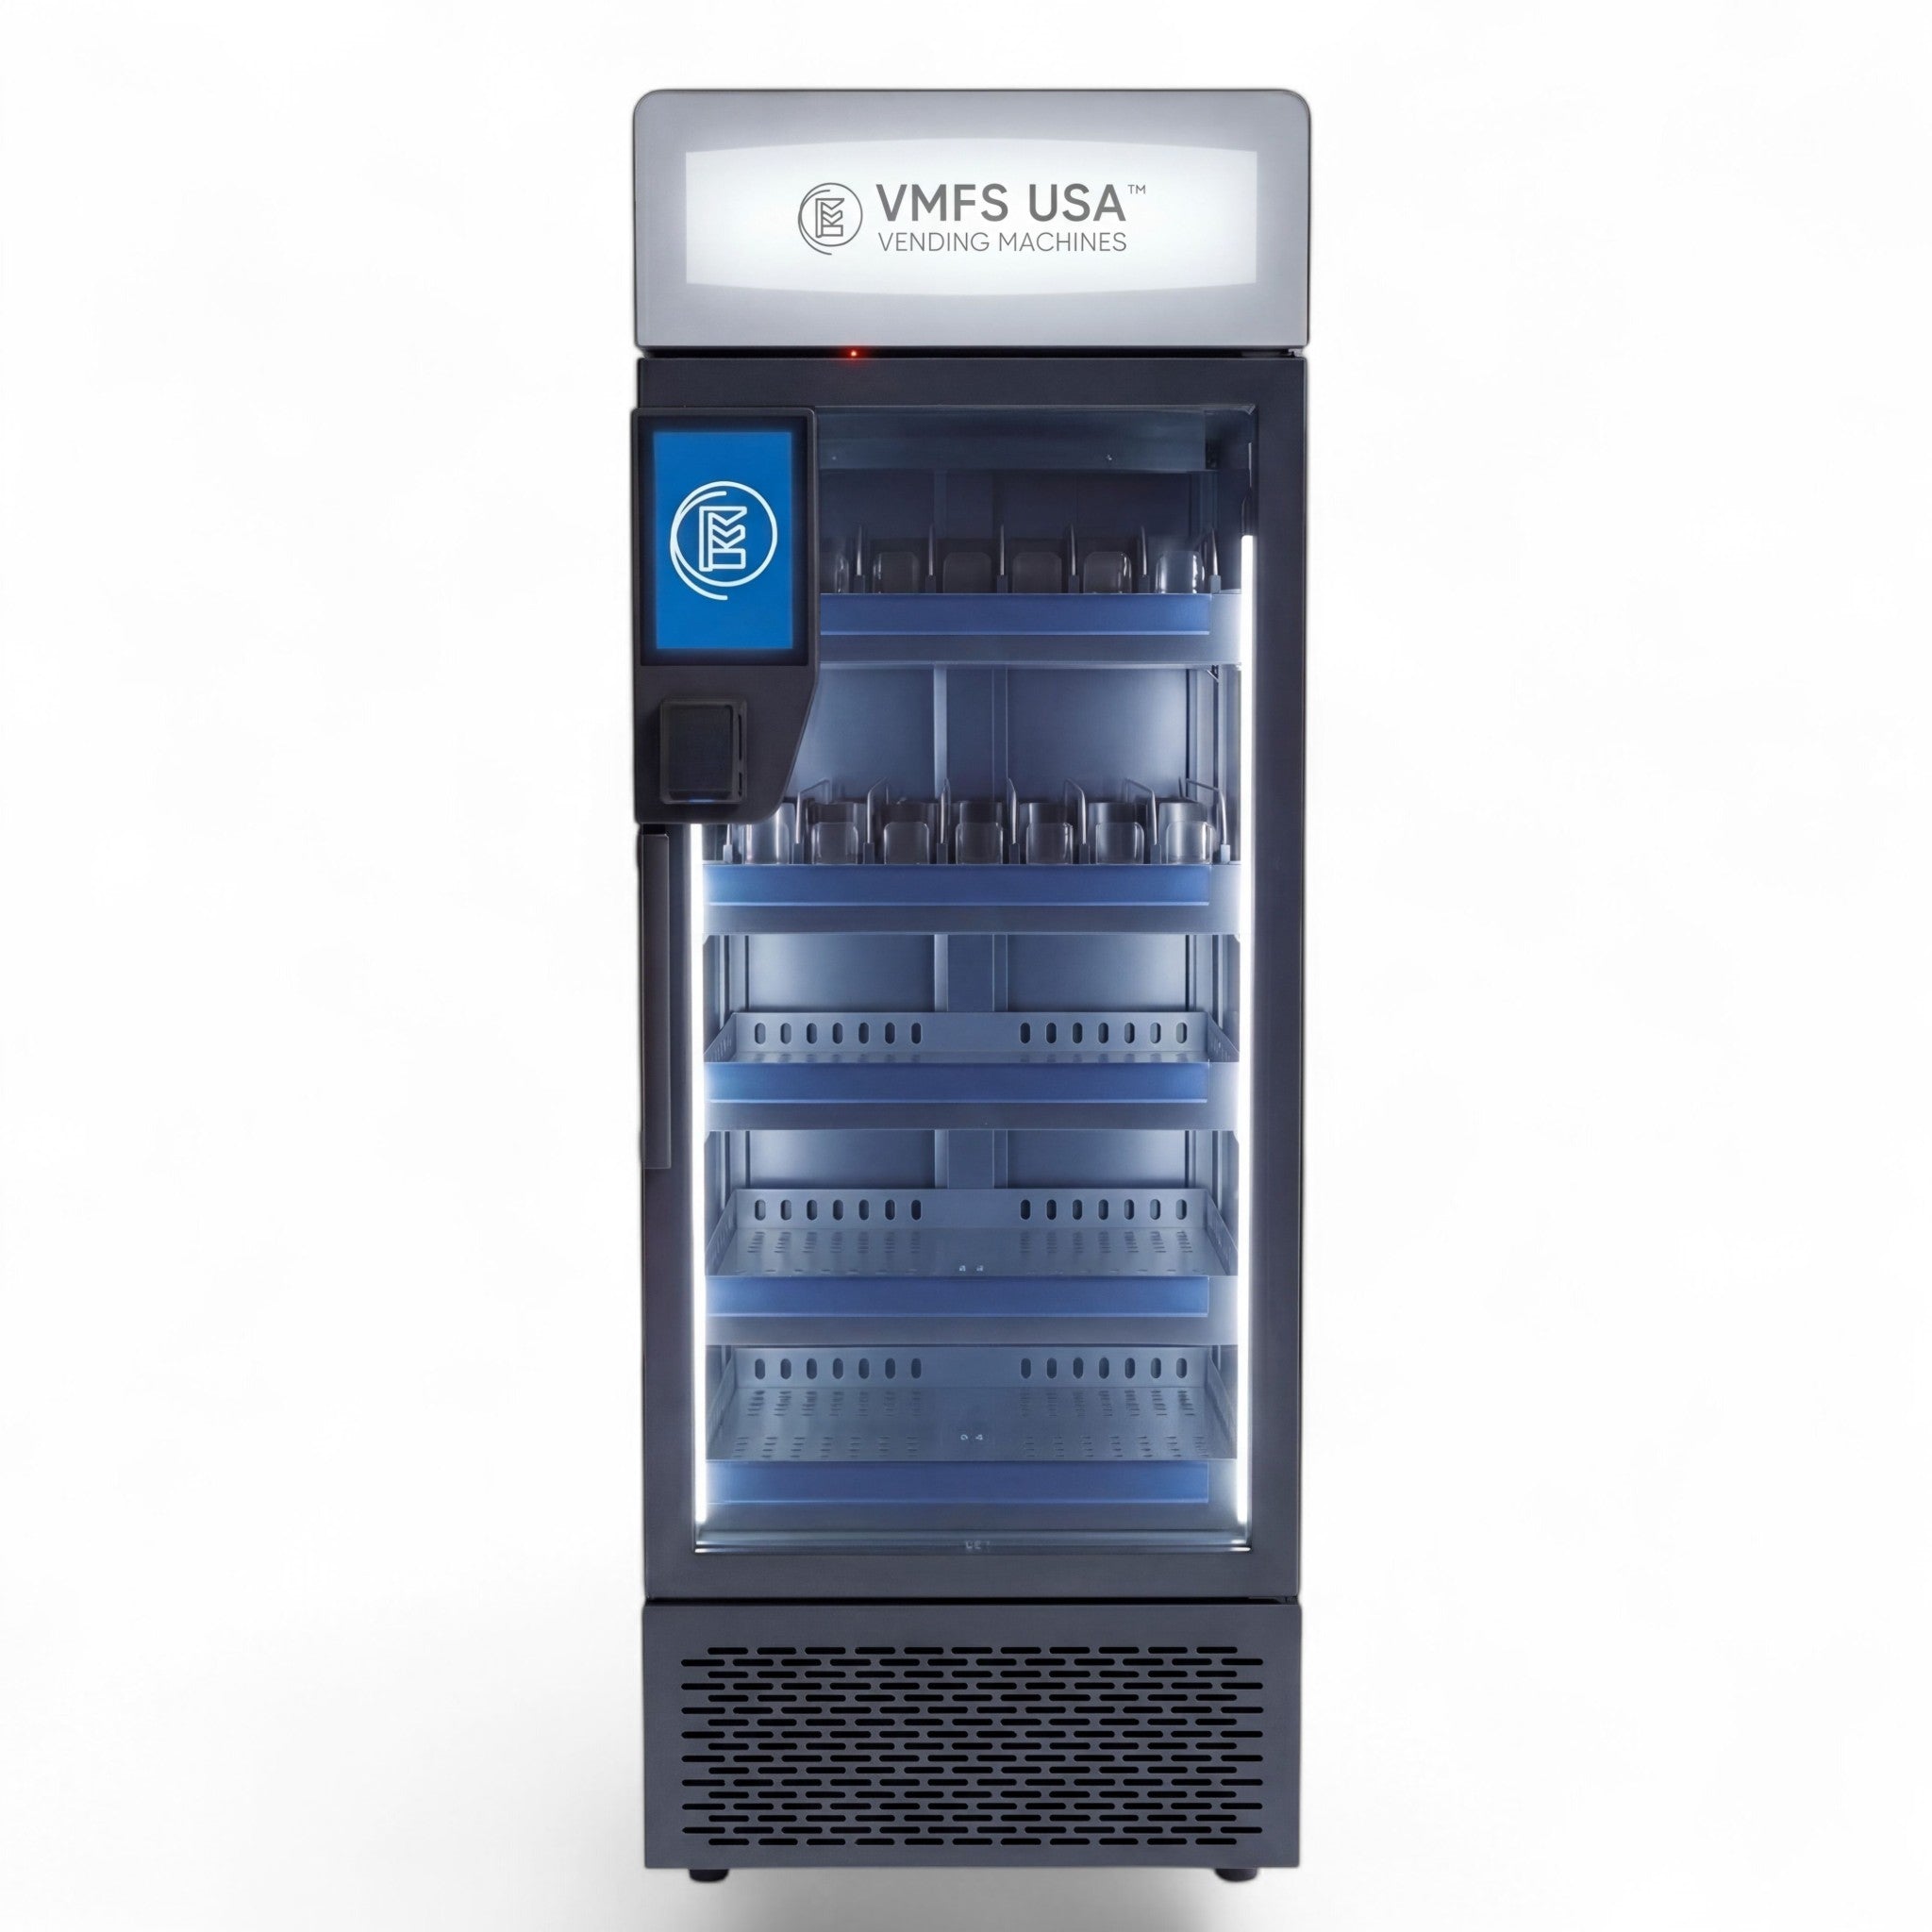
When you are ready to match hardware to the product set, you can buy vending machines across snack, drink, combo, coffee and specialty builds, or browse the in stock range if a site has already agreed a placement and is waiting on delivery, since those units ship in 7 to 21 days with a one year parts warranty. For the full catalogue alongside placement, compliance and marketing support, see all vending machines.
Share:
How To Start A Vending Machine Business In Alabama
How To Start A Vending Machine Business In Alabama