


Tracking vending machine ROI per machine requires dividing your annual net operating profit (gross sales minus COGS, commission, card processing, telemetry fees, and route labor) by your total initial capital invested (machine purchase, delivery, card reader, and site setup). Calculating this metric per machine—rather than across your entire route—exposes underperforming placements, prevents high-volume locations from subsidizing unprofitable boxes, and provides the exact payback period in months for every asset in your fleet.
Why Per-Machine ROI Tracking Separates Pros from Amateurs
Evaluating fleet revenue as a single lump sum is one of the most dangerous financial mistakes a route operator can make. When you look at total monthly bank deposits across ten locations, a top-performing breakroom pulling $2,500 per month easily masks a dead warehouse location losing $150 per month. You end up spending labor hours, gas, and inventory holding costs to service a machine that actively drains cash flow.
Tracking vending machine ROI per machine exposes the precise financial performance of every piece of hardware on your route. Each machine operates as an independent profit center with its own cost structure, foot traffic patterns, and product turnover rate. Measuring profitability at the individual machine level allows you to make data-backed decisions: when to renegotiate location commissions, when to swap product selections, and when to pull a machine and move it to a higher-yield property.
Step-by-Step Formula for Tracking Vending Machine ROI per Machine
To calculate true return on investment, you must isolate the total capital invested in a specific unit and contrast it against the net operating income that specific unit generates over a 12-month period.

1. Capital Expenditure (CapEx) Baseline
Capital expenditure (CapEx) represents the total upfront cost required to acquire, transport, equip, and install a vending machine at a specific location before it sells its first product.
To establish your baseline CapEx for an individual machine, sum the following line items:
-
Machine Acquisition Cost: The purchase price of the new or refurbished machine.
-
Freight and White-Glove Delivery: Shipping fees plus local rigging or stair-climbing delivery service to get the unit onto the floor.
-
Payment Processing Hardware: The cost of the card reader unit and mounting bracket.
-
Initial Locks, Signage, and Branding: Custom vinyl wraps, location-specific decals, or high-security lock cylinders.
-
Site Preparation: Out-of-pocket costs for dedicated electrical outlets, water filtration hookups for coffee units, or floor anchors.
Example CapEx Calculation:
-
Used Refurbished Combo Machine: $3,400
-
Freight and Inside Delivery: $350
-
Cashless Card Reader Hardware: $299
-
Security Lock Cylinder & Custom Decal: $75
-
Total CapEx Baseline: $4,124
2. Operating Expense (OpEx) Breakdown
Operating expenses (OpEx) are the ongoing, recurring costs directly required to keep an individual machine stocked, powered, connected, and maintained on location.
Do not estimate or guess these numbers. Track each line item monthly:

Line-Item Definitions & Benchmark Calculations:
-
Cost of Goods Sold (COGS): COGS is the direct wholesale cost paid to suppliers for the snacks, drinks, or specialty items sold out of the machine. Target a COGS between 30% and 40% of gross retail sales. If a bag of chips sells for $2.00, your wholesale cost should not exceed $0.70 to $0.80.
-
Location Commission: Location commission is the contractual percentage of gross or net sales paid to the property owner for housing your equipment. Rates typically range from 0% (unserviced or small breakrooms) to 15% (high-traffic transit hubs). Understanding the vending machine revenue split between operator and property owner is critical before signing location contracts.
-
Merchant Processing & Telemetry Fees: Cashless card processing fees average 5.95% to 6% per transaction when combining gateway rates and interchange fees. Telemetry—the cellular device inside the machine that transmits sales and inventory data to your management software—costs $8.00 to $12.00 per month in continuous connectivity fees.
-
Spoilage and Shrinkage: Spoilage refers to expired food products that must be thrown away, while shrinkage covers theft or inventory discrepancies. Budget 2% to 4% of gross sales for spoilage on snack units, and up to 8% on fresh food or refrigerated units.
-
Maintenance Reserve: Vending machine maintenance costs cover bill acceptors, coin mechanisms, drop sensors, and refrigeration deck repairs. Allocate 3% to 5% of monthly gross revenue into a reserve account for ongoing upkeep.
-
Allocated Route Travel Costs: Calculate your total monthly fuel and vehicle maintenance costs, then divide by the total number of restock visits across your route. Assign that per-visit cost directly to the machine based on how many times per month you service it.
Worked-Out ROI & Payback Case Study
Consider a combo vending machine placed in a 120-person manufacturing facility breakroom.
Machine Financial Data (Monthly):
-
Initial CapEx: $4,200
-
Monthly Gross Revenue: $1,450 (1,000 total vends averaging $1.45/item)
-
COGS (38% average): $551.00
-
Location Commission (10% of gross): $145.00
-
Merchant Processing (6% of gross): $87.00
-
Telemetry Monthly Service Fee: $10.00
-
Spoilage/Shrinkage (3% of gross): $43.50
-
Maintenance Reserve (4% of gross): $58.00
-
Allocated Route Fuel & Service Labor: $65.00
Essential Metrics to Track for Every Machine
To maintain peak financial health across your route, monitor these four performance indicators for every individual box on a monthly basis:
1. Payback Period (Months)
Payback period measures the exact number of months required for a machine’s net operating cash flow to fully recover its initial CapEx investment.
-
Target Benchmark: 10 to 18 months. Any machine with a payback period under 12 months is an exceptional placement. A payback period exceeding 24 months indicates an underperforming machine or an overpriced hardware purchase.
2. Gross Margin Percentage
Gross margin percentage reflects the profitability of your product pricing structure before accounting for location commissions or route labor. Calculate this by subtracting COGS from gross revenue, then dividing by gross revenue.
-
Target Benchmark: 55% to 65%. Maintaining healthy vending machine profit margins requires pricing items at a 2.5x to 3.0x markup over wholesale cost. Review our guide to price products for profit without losing sales to optimize item pricing schedules.
3. Net Yield per Restock Visit
Net yield per visit measures how much net profit is generated every time your service truck pulls into the location parking lot.
-
Target Benchmark: $35 to $75+ per visit. If you visit a machine four times a month and it only generates $60 in total monthly net profit, your yield per visit is $15. That is insufficient to cover driver travel time and vehicle wear.
4. Machine Uptime Percentage
Machine uptime percentage measures the proportion of total time a machine is operational, fully stocked, and capable of accepting cash and card payments.
-
Target Benchmark: 98%+ uptime. A machine out of order or sitting with a jammed coin mechanism generates $0 in revenue while fixed telemetry and insurance costs continue to accrue. Review routine vending machine maintenance costs to keep equipment functional and online.
How to Set Up Your Per-Machine ROI Tracking System
Establishing an accurate tracking workflow requires structured record-keeping, whether you manage three machines on a manual spreadsheet or fifty machines using automated telemetry systems.
Method A: Telemetry and Vending Management Software (Recommended)
Vending Management Software (VMS) integrated with cellular card readers automates financial tracking. The card reader plugs into the machine’s internal control board via a DEX (Data Exchange) port—a standardized communication interface that logs every product dispense, cash bill inserted, and coin payout.
-
Automated Cash and Card Reconciliation: VMS software reads DEX audit files to report exact cash sales versus card sales in real-time.
-
Pre-Kitting Efficiency: The system calculates product depletion remotely, allowing drivers to pack exact restock inventory in the warehouse.
-
Automated Profit Reporting: The software matches wholesale item costs directly against vend prices, generating real-time per-machine profit and loss statements.
Deploying smart equipment, such as units from our drinks vending machine collection fitted with cellular telemetry, streamlines data collection across high-volume drink routes.
Method B: Manual Ledger / Spreadsheet System
If operating on a tight budget without full telemetry across all machines, use a standardized manual tracking ledger for every machine visit:
-
Record Cash Meter and Card Reader Totals: Record the non-resettable physical meter readings inside the machine and export monthly card gateway settlement statements.
-
Log Restock Quantities and COGS: Record every case of inventory placed into the machine alongside its wholesale unit cost using dedicated workflows for tracking vending machine stock.
-
Track Waste at Restock: Record every expired or damaged item removed from spirals on a waste log sheet.
-
Compile Monthly Expense Summary: Deduct fixed location commissions, payment processing merchant fees, and allocated fuel expenses at the end of every calendar month.
Action Framework: What to Do When a Machine Underperforms
When per-machine ROI metrics reveal that a location is falling short of target profitability, apply a structured decision framework rather than pulling equipment immediately.

1. Renegotiate Location Commission
If a machine generates $1,800 in monthly sales but yields a low net margin due to a 15% location commission, present real financial numbers to the facility manager.
-
The Pitch: Explain that rising wholesale product costs and merchant transaction processing require adjusting the commission structure from 15% down to 5% (or a flat monthly fee) to keep the machine on-site.
-
Alternative: Offer to swap cash commissions for premium employee perks, such as subsidizing fresh coffee or healthy options from specialized snack vending machines.
2. Optimize Product Mix and Pricing
When gross revenue is steady but margins fall below 50%, the product mix is misaligned with customer demand or wholesale costs are too high.
-
Replace slow-moving, high-COGS brand-name items with higher-margin alternatives.
-
Increase vend prices in $0.25 increments across top-selling categories.
-
Adjust spiral spacing to match fast-selling package sizes and reduce sold-out selections between restock visits.
3. Relocate Machine Within the Building
A machine tucked away in a rear service hallway near loading docks will underperform compared to the same machine positioned in a central breakroom or main lobby.
-
Request a physical relocation within the building to capture higher foot traffic and dwell time.
-
Ensure placement near seating areas, micro-markets, or main building entrances where foot traffic is highest.
4. Pull and Redeploy the Machine
If a machine consistently generates less than $300 per month in gross sales after 90 days of product optimization and site adjustment, pull the machine. Servicing a low-volume site drains driver time and capital that could be deployed at a higher-yielding location.
Reviewing your legally binding vending machine location contracts ensures you provide proper written termination notice (typically 30 days) before pulling hardware off-site.
5 Lethal Mistakes Operators Make in ROI Calculations
Avoid these five financial tracking errors that distort machine performance metrics:
-
Forgetting Merchant Gateway and Batch Fees: Card reader processors charge a percentage of sales (e.g., 5.95%) plus fixed daily batch closure or transaction communication fees. Omitting these fees inflates calculated net profit by 6% to 8%.
-
Ignoring Vehicle Depreciation and Restock Travel Time: Driving 45 minutes round-trip twice a week to service a low-volume machine costs real money in fuel, insurance, and labor. Factor travel distance directly into your per-machine OpEx calculations.
-
Failing to Track Spoilage and Expired Inventory: Removing six expired sandwiches or yogurt parfaits from a cold machine represents a direct loss of wholesale capital. Log every expired item as a direct COGS expense.
-
Treating Gross Sales as Take-Home Income: Pulling $1,000 in cash and card settlements from a machine does not mean you made $1,000. After deducting COGS, commissions, taxes, merchant fees, and maintenance reserves, true net profit is typically $200 to $350.
-
Averaging Machine Expenses Across the Fleet: Assigning fixed average maintenance or fuel costs across all machines hides problem units. A 15-year-old machine that breaks down constantly should carry its actual repair invoice costs on its individual ledger.
Next Steps: Optimize Your Fleet for Maximum Yield
Accurately tracking vending machine ROI per machine gives you total operational control over your route. With hard data for every asset, you can systematically eliminate losing locations, optimize pricing structures, and reinvest cash flow into high-yielding equipment.
-
Audit Every Machine: Gather receipts, wholesale invoices, and DEX logs to create an individual financial ledger for every active machine in your fleet.
-
Identify Bottom 10% Performers: Isolate machines generating a payback period longer than 24 months or yielding less than $35 per restock visit.
-
Execute Corrective Actions: Apply the location decision framework: adjust pricing, renegotiate commission terms, or pull underperforming hardware.
-
Scale High-Yield Assets: Reinvest profits from top-tier locations into modern, energy-efficient equipment outfitted with card readers and telemetry.
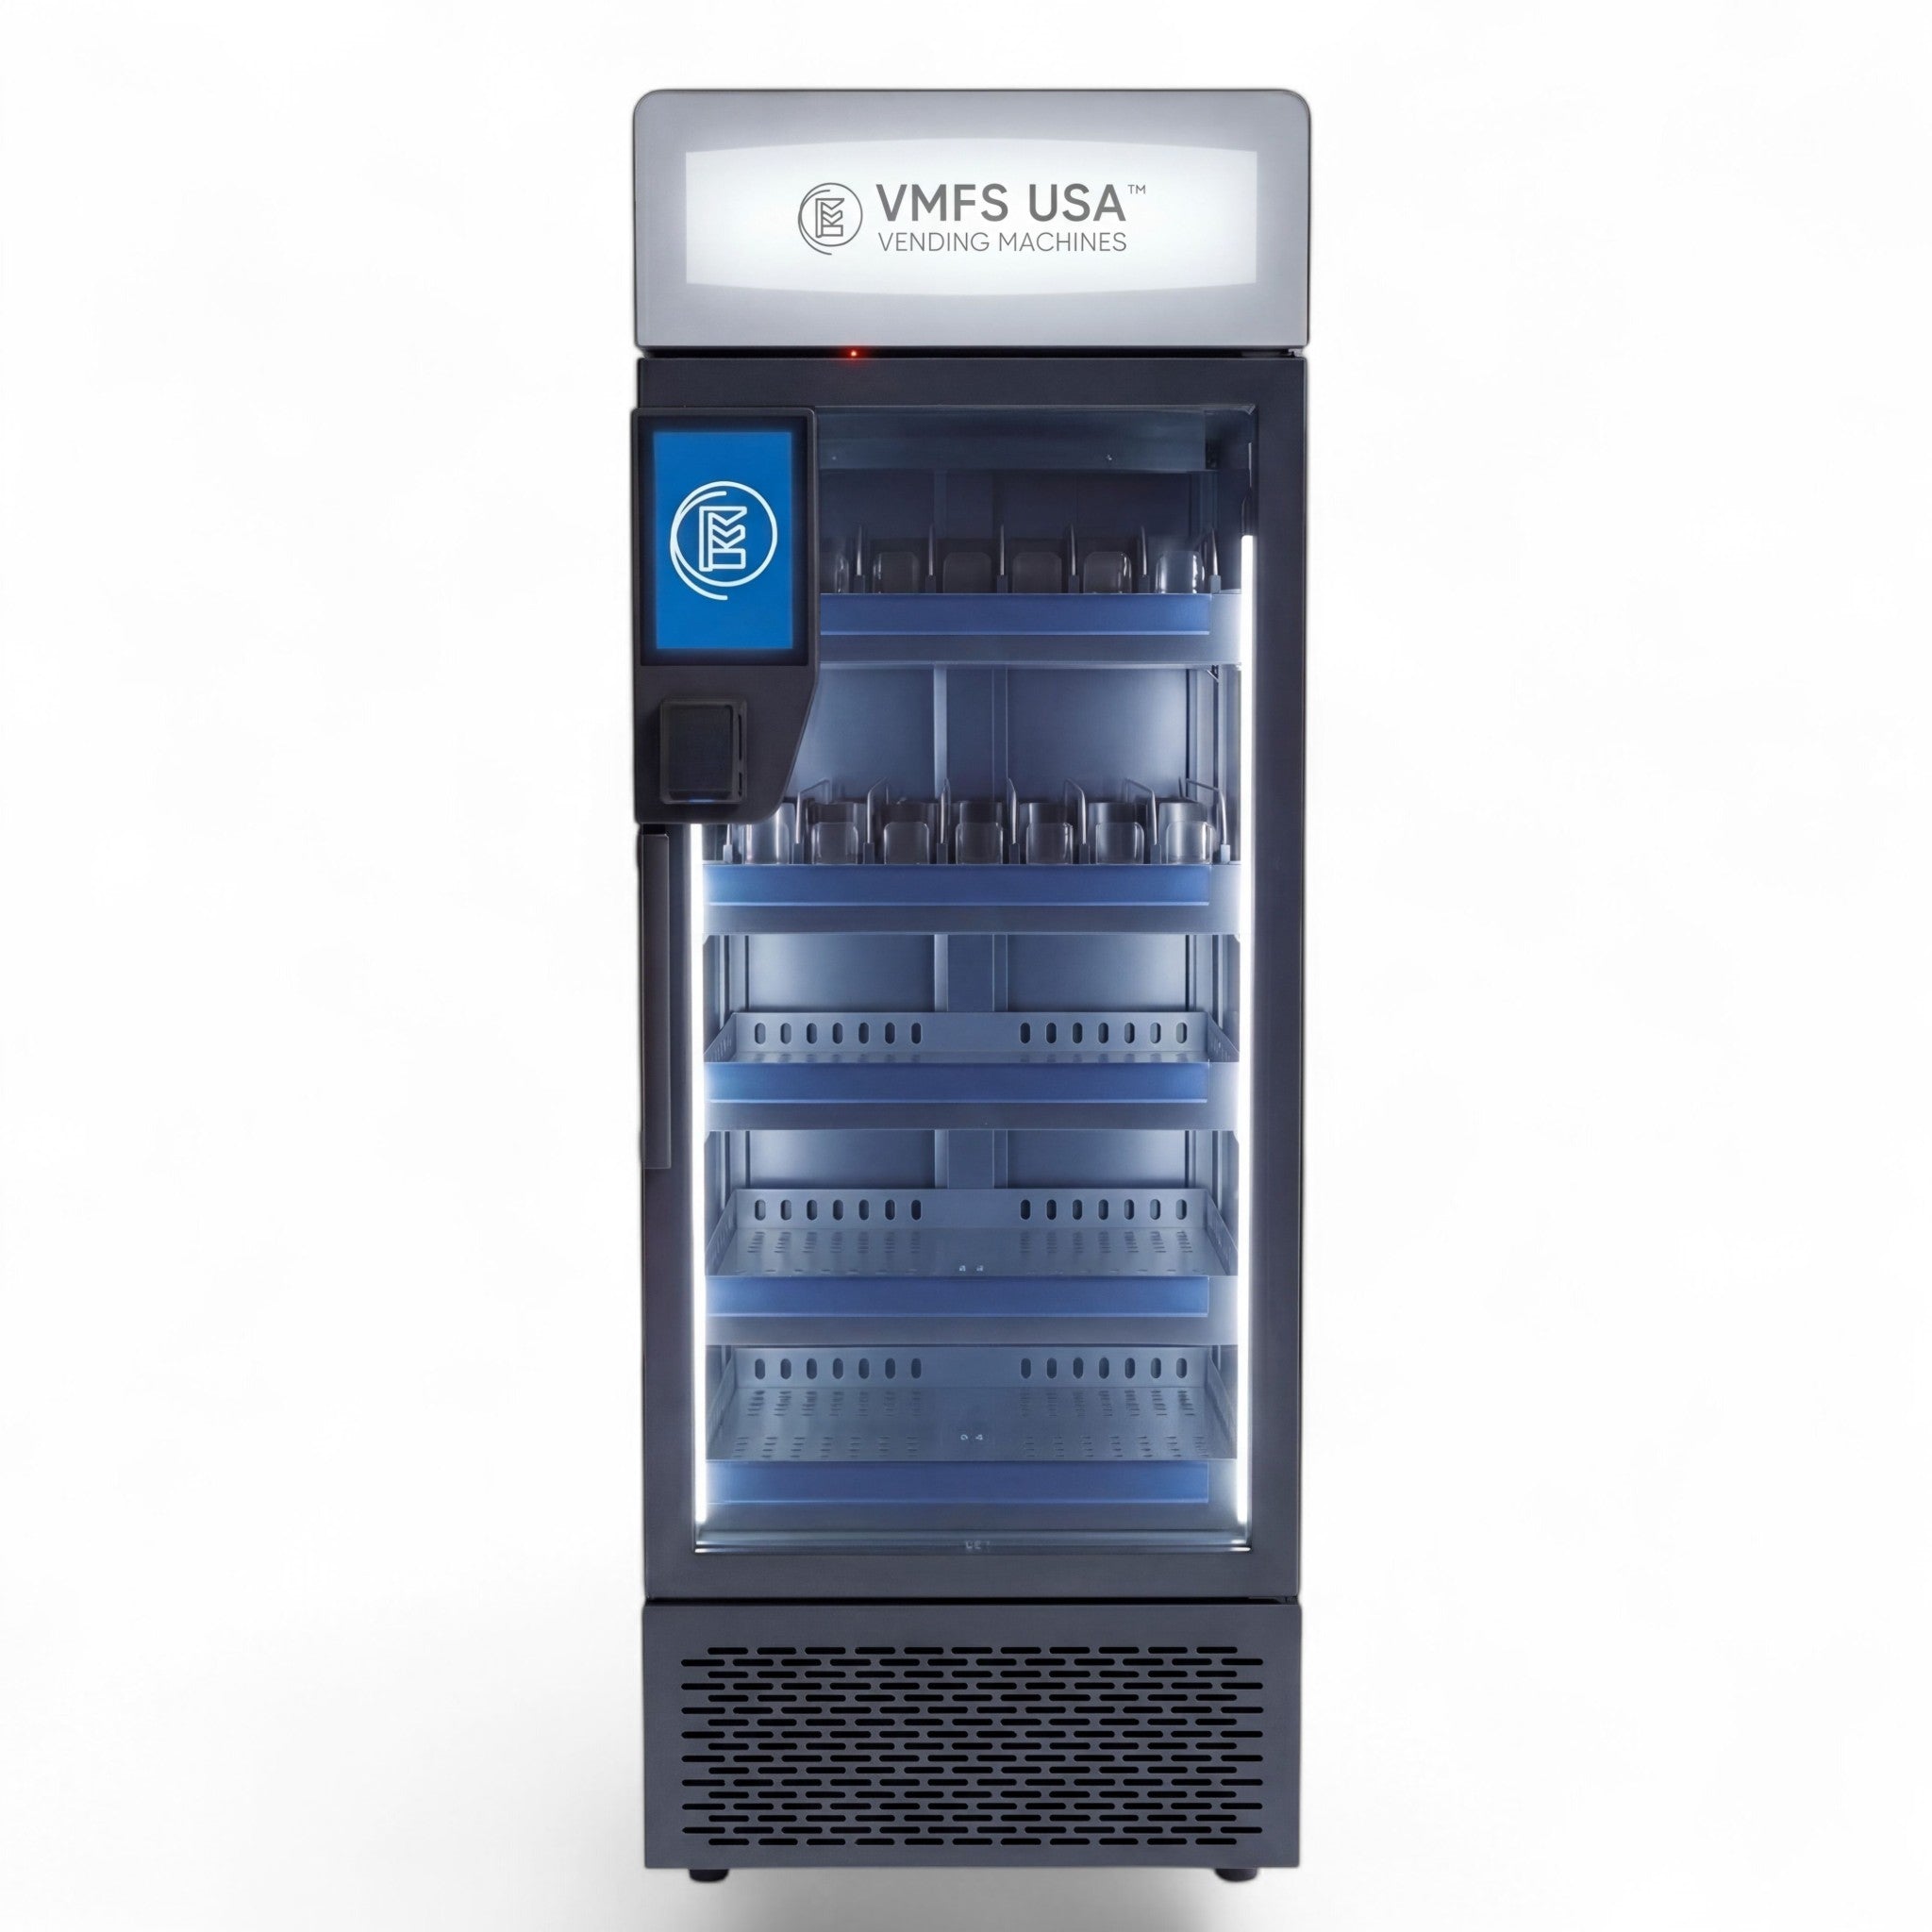
Explore our commercial line of high-capacity snack vending machines, drinks units, and specialized equipment at VMFS USA to expand your route with reliable profit centers built for maximum ROI.
Frequently Asked Questions
What is a good return on investment (ROI) for a vending machine?
A healthy annual net ROI for a commercial vending machine ranges between 80% and 150%, which translates to a complete payback period of 8 to 15 months on initial capital invested. High-traffic placements with low commission rates can achieve even higher yields, recovering equipment costs in under six months.
How long should I give an underperforming vending machine before pulling it?
You should track an underperforming location for 60 to 90 days before making a final decision to pull the equipment. During this window, test pricing adjustments, optimize product selection, and request a higher-traffic physical placement within the building before issuing contract termination notice.
How do credit card reader fees impact per-machine ROI?
Card processing fees lower net monthly margins by roughly 5% to 8% of gross cashless sales due to gateway fees, interchange charges, and monthly telemetry connectivity costs. However, adding card readers typically increases total sales volume by 20% to 40%, making them a net positive for overall machine profit.
What is the most common hidden expense in vending machine operations?
Product spoilage and unaccounted restock travel time are the most common hidden expenses in vending route operations. Failing to track expired food items removed from the machine and omitting vehicle fuel costs inflates calculated net profitability, creating a false impression of site performance.
How does location commission affect a vending machine’s break-even point?
Higher location commission rates increase the baseline sales volume required for a machine to break even each month. For example, paying a 15% commission vs. a 5% commission increases the required monthly item sales volume needed to cover fixed telemetry, maintenance, and route labor overhead.
Share:
Common Vending Machine Problems and Solutions: Troubleshooting Guide
Outdoor Vending Machines: How They Actually Perform in US Climates