


El margen promedio de las máquinas expendedoras por artículo oscila entre el 40% y el 80% de beneficio bruto, mientras que el margen neto por máquina suele situarse entre el 15% y el 30% después de contabilizar las comisiones por ubicación, las tarifas de procesamiento de tarjetas, el deterioro y el mantenimiento de la ruta. Las bebidas frías y el café caliente ofrecen los márgenes por artículo más altos (60%–85%), mientras que los alimentos frescos y los bocadillos de marca ofrecen márgenes brutos más bajos (35%–50%) debido a un mayor costo de los bienes vendidos (COGS) y a los riesgos de caducidad.
Por qué los márgenes de beneficio dictan la supervivencia de una ruta de vending
Evaluar una ruta basándose únicamente en los ingresos brutos es la forma más rápida de fracasar en el comercio minorista automatizado. Una ruta de vending que genera 10.000 dólares en ventas brutas mensuales puede proporcionar desde 3.000 dólares en beneficio neto real hasta una pérdida neta una vez que se deducen el reabastecimiento de inventario al por mayor, el procesamiento de transacciones, el alquiler del sitio y los gastos generales del vehículo.
Para construir una empresa sostenible, los operadores deben realizar un seguimiento de dos métricas de rendimiento distintas: el margen de la máquina expendedora por artículo (la economía unitaria de las unidades de inventario individuales) y el margen por máquina (el rendimiento financiero neto total de un equipo específico en un sitio determinado). El margen de beneficio bruto representa el porcentaje de ingresos que queda después de restar el costo directo de los bienes vendidos (COGS), que es el precio de compra al por mayor del producto. El margen de beneficio neto representa el efectivo neto restante después de deducir todos los gastos operativos generales, incluidas las tarifas de conexión del lector de tarjetas, la depreciación de la máquina, el alquiler del local y el mantenimiento rutinario.
Comprender estas métricas permite a los operadores optimizar la selección de productos, eliminar las referencias (SKU, por sus siglas en inglés) de bajo rendimiento, negociar contratos de ubicación sostenibles e implementar equipos que se alineen con el poder adquisitivo demográfico del lugar.
Desglose del margen de la máquina expendedora por artículo según la categoría
El margen bruto de la máquina expendedora por artículo varía drásticamente según la clasificación del producto, la vida útil, el acceso a compras al por mayor y la sensibilidad al precio del consumidor.

Matriz de comparación de márgenes a nivel de artículo
La siguiente tabla desglosa la economía unitaria de las principales categorías de productos que se encuentran en los entornos de comercio minorista automatizado:
| Categoría de producto | COGS mayorista promedio | Precio minorista de vending promedio | Beneficio bruto ($) | Margen bruto (%) | Tasa típica de deterioro/desperdicio |
| Bocadillos de marca nacional (papas fritas, dulces) | $0.60 - $0.85 | $1.50 - $2.25 | $0.90 - $1.40 | 55% - 62% | < 1% (Vida útil larga) |
| Bebidas frías (latas de 12 oz) | $0.40 - $0.55 | $1.50 - $2.00 | $1.10 - $1.45 | 70% - 74% | < 0.5% |
| Bebidas frías (botellas de 20 oz) | $0.85 - $1.10 | $2.50 - $3.25 | $1.65 - $2.15 | 65% - 68% | < 0.5% |
| Bebidas energéticas y aguas especializadas | $1.20 - $1.60 | $3.50 - $4.50 | $2.30 - $2.90 | 64% - 66% | 1% - 2% |
| Café caliente y espresso (de grano a taza) | $0.18 - $0.35 | $2.00 - $3.50 | $1.82 - $3.15 | 80% - 90% | 2% - 4% (Granos/Leche) |
| Comida fresca (sándwiches, ensaladas) | $2.20 - $3.50 | $4.50 - $7.00 | $2.30 - $3.50 | 48% - 52% | 10% - 25% (Alto riesgo) |
| Comidas congeladas y helados | $1.10 - $1.80 | $3.00 - $4.50 | $1.90 - $2.70 | 58% - 62% | 2% - 3% |
| Medicamentos OTC / Cuidado personal | $0.75 - $1.50 | $4.00 - $8.00 | $3.25 - $6.50 | 75% - 82% | < 0.5% |
| Electrónica / Accesorios móviles | $2.50 - $6.00 | $12.00 - $25.00 | $9.50 - $19.00 | 75% - 80% | 0% |
Bocadillos y confitería estándar
Los bocadillos salados preenvasados, las barras de chocolate y la bollería constituyen el volumen principal de las rutas de vending tradicionales. Debido a que estos artículos de marca están ampliamente disponibles en los canales de supermercados, la elasticidad del precio (el grado en que la demanda del consumidor cambia cuando cambian los precios) es relativamente alta.
-
Abastecimiento mayorista: Comprar papas fritas y dulces en cantidades de caja a través de clubes de almacenes o distribuidores especializados reduce los costos unitarios a 0,55–0,75 dólares por bolsa o barra.
-
Techo de precios: Intentar fijar el precio de las bolsas de papas fritas estándar de 1.5 oz por encima de los 2,00 dólares en ubicaciones no cautivas a menudo provoca una caída en la velocidad de ventas unitarias.
-
Perfil de margen: Los márgenes de beneficio bruto se sitúan constantemente entre el 50% y el 62%. La ventaja clave de esta categoría es el deterioro mínimo del inventario. Los bocadillos estables ofrecen regularmente de 6 a 12 meses de vida útil, lo que preserva el flujo de caja.
Bebidas frías (latas, botellas, bebidas energéticas)
Las bebidas generan el margen bruto en efectivo más confiable en las rutas tradicionales. Las bebidas frías tienen una fuerte demanda de los consumidores independientemente de la temporada, particularmente en instalaciones industriales, de fabricación y deportivas.
-
Latas frente a botellas: Las latas de 12 oz ofrecen márgenes porcentuales más altos (hasta el 75%), pero las botellas de 20 oz generan un margen en dólares absoluto más alto por venta. Una botella vendida por 2,75 dólares con un COGS de 0,95 dólares genera 1,80 dólares de beneficio bruto en efectivo, en comparación con los 1,25 dólares de una lata vendida a 1,75 dólares.
-
Bebidas energéticas y funcionales: Marcas como Red Bull, Monster y Celsius tienen costos mayoristas más altos (1,30–1,60 dólares), pero alcanzan precios minoristas entre 3,50 y 4,50 dólares. Esto crea un rendimiento bruto en efectivo por venta superior a 2,20 dólares.
-
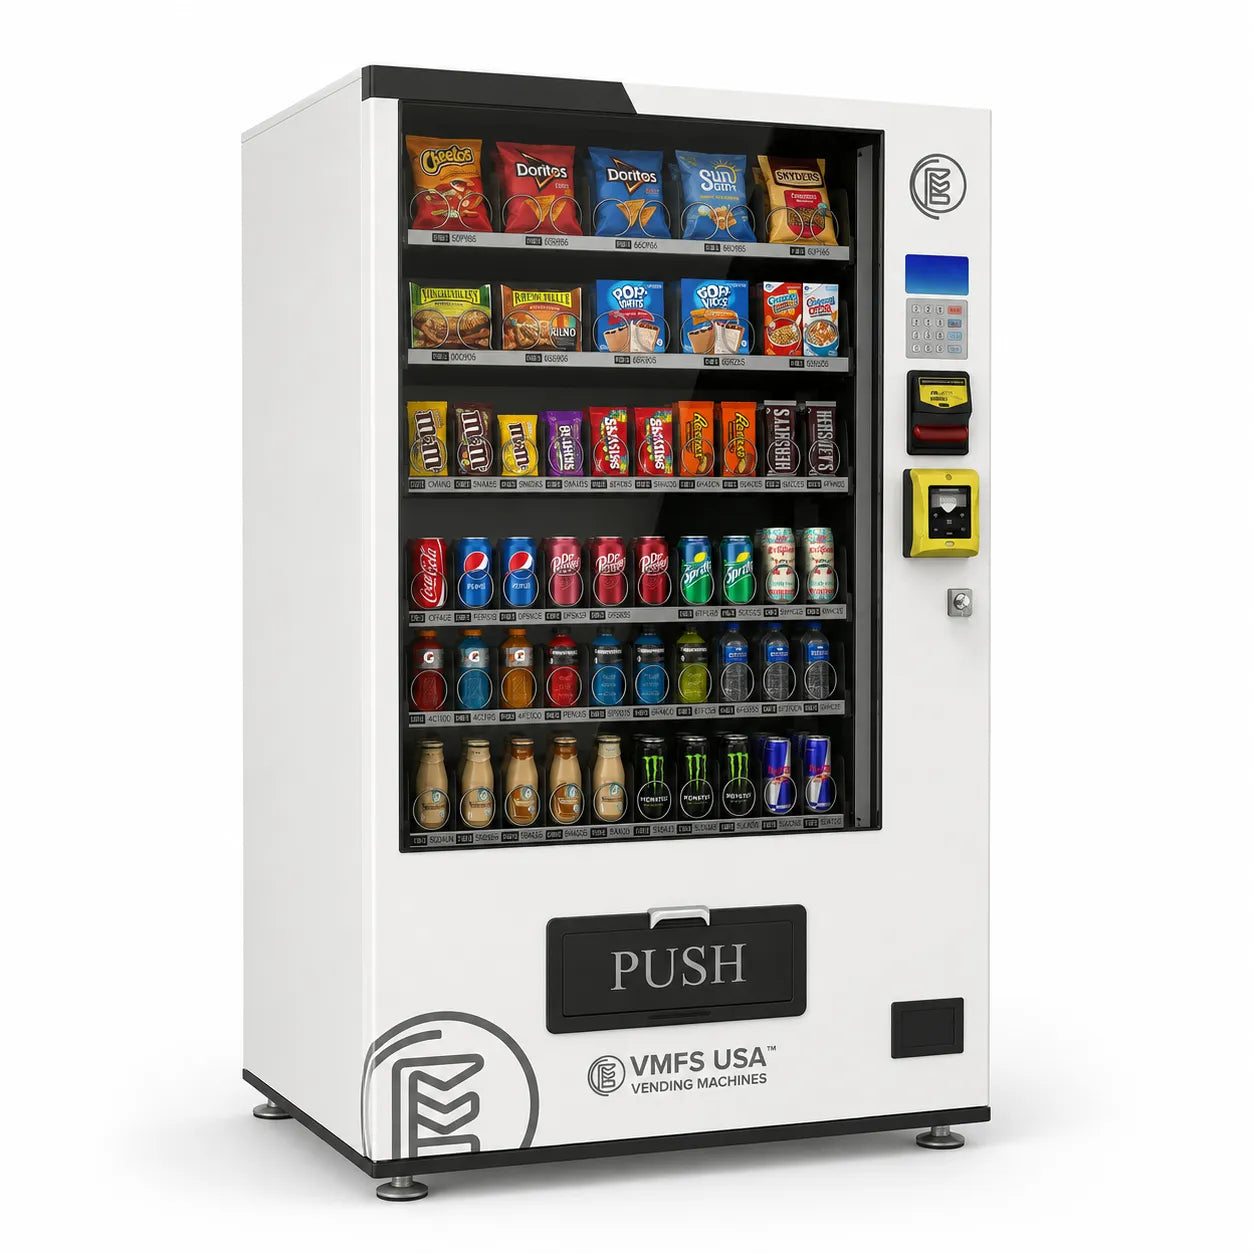
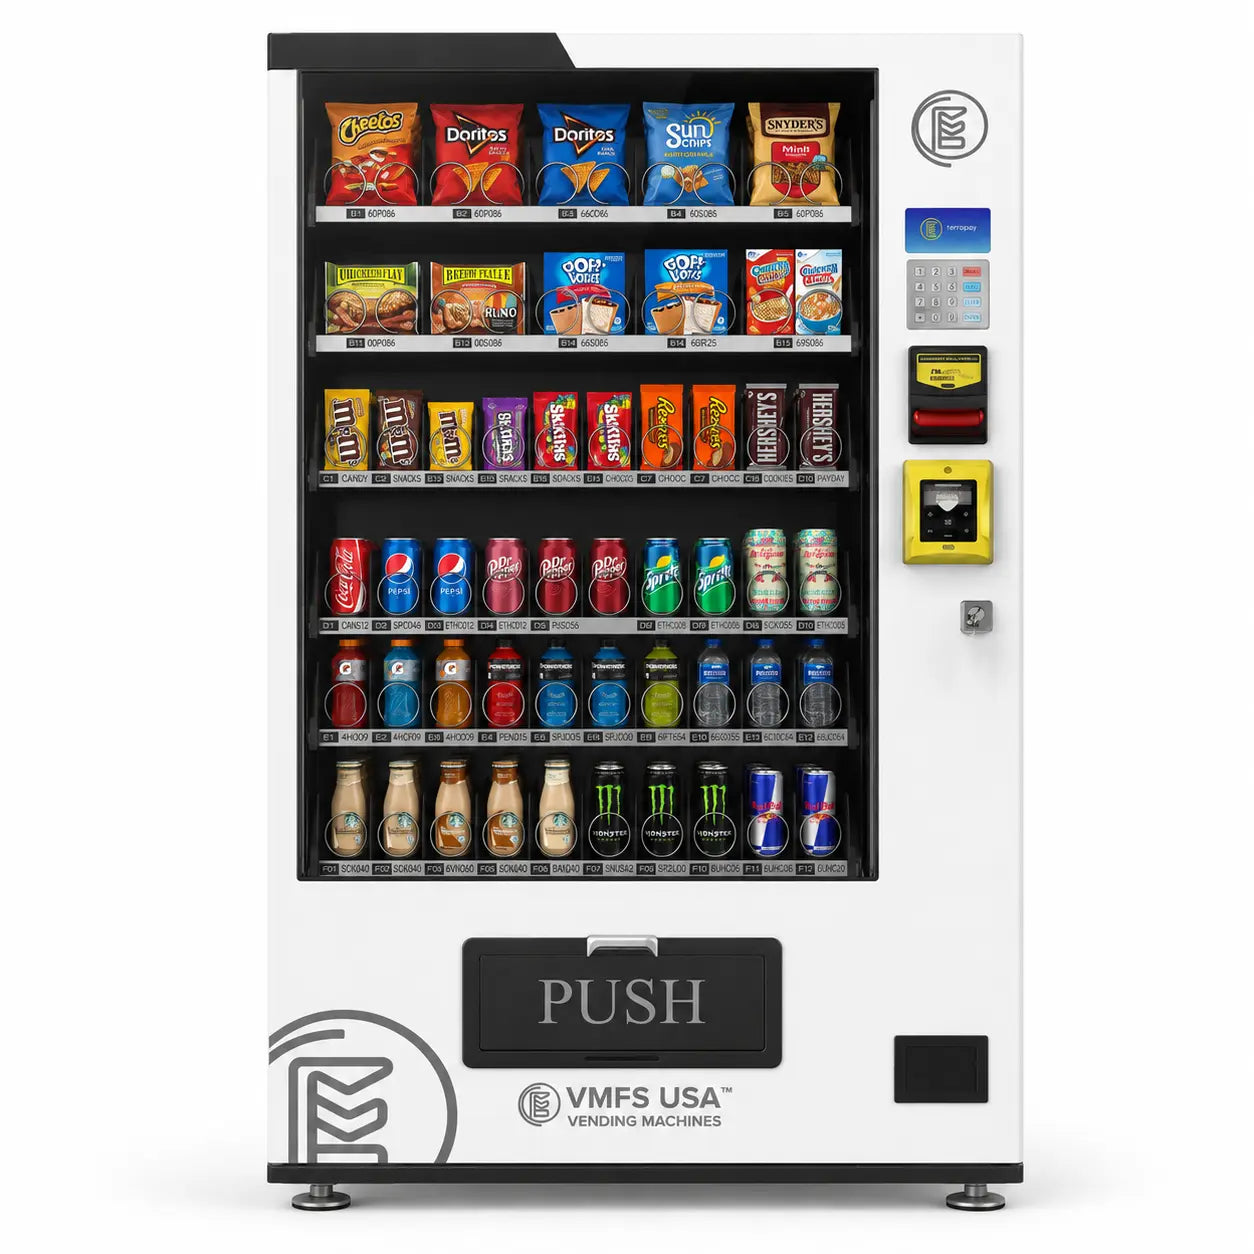
Abastecimiento de equipos: Los operadores que buscan sitios de bebidas de alto volumen a menudo utilizan equipos versátiles como máquinas expendedoras combinadas para capturar tanto las compras impulsivas de bocadillos como de bebidas desde un solo punto.
Artículos especiales de alto margen (café, comida fresca, electrónica, comercio minorista inteligente con IA)
Las categorías de vending especializadas se alejan de los artículos de bajo costo hacia modelos minoristas de alto margen o alto valor.
-
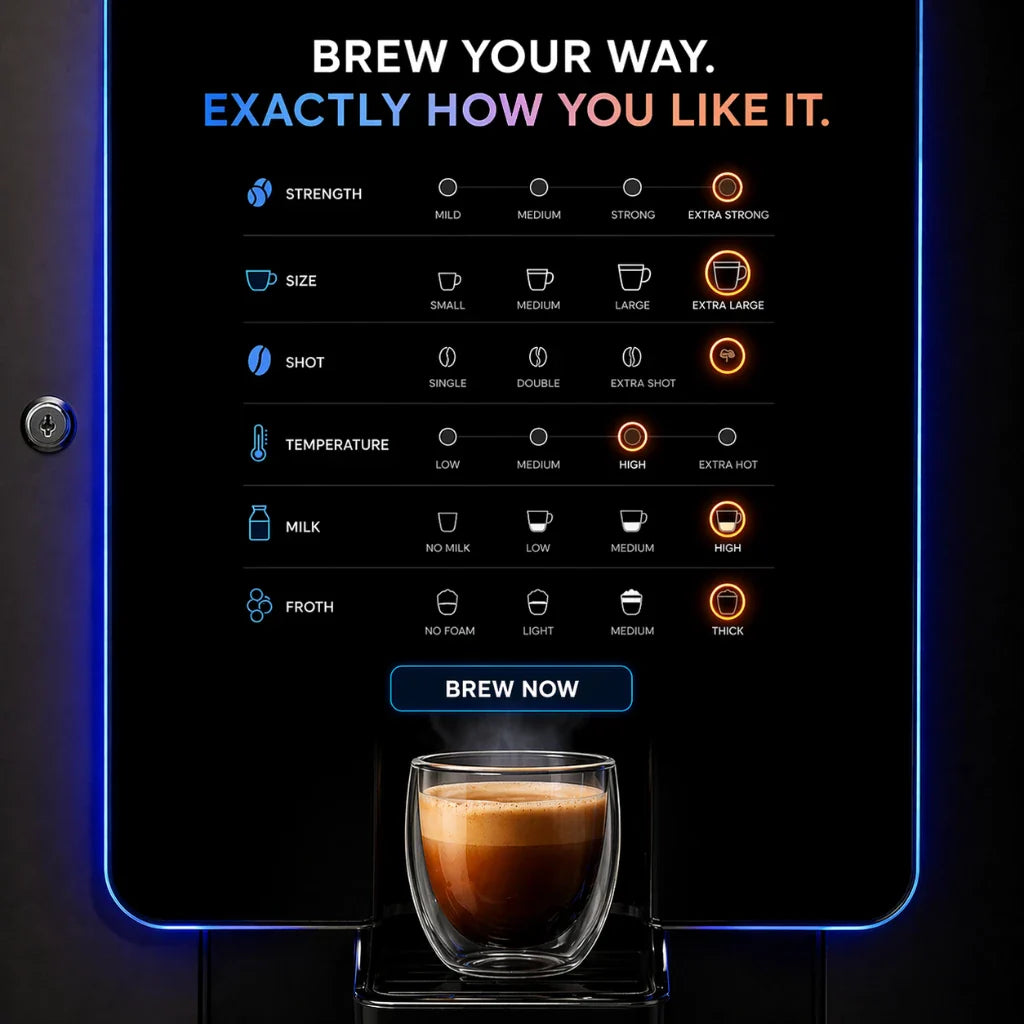
Café de grano a taza: El café caliente es el líder indiscutible en márgenes en el comercio minorista automatizado. Los concentrados de café líquido o granos enteros, vasos de papel, tapas y leche en polvo cuestan en conjunto de 0,20 a 0,35 dólares por taza. Vender esa taza por 2,50 dólares genera un margen bruto de más del 86%. Los operadores interesados en la distribución de bebidas calientes pueden revisar las opciones de hardware dedicadas a través de la colección de máquinas expendedoras de café.
-
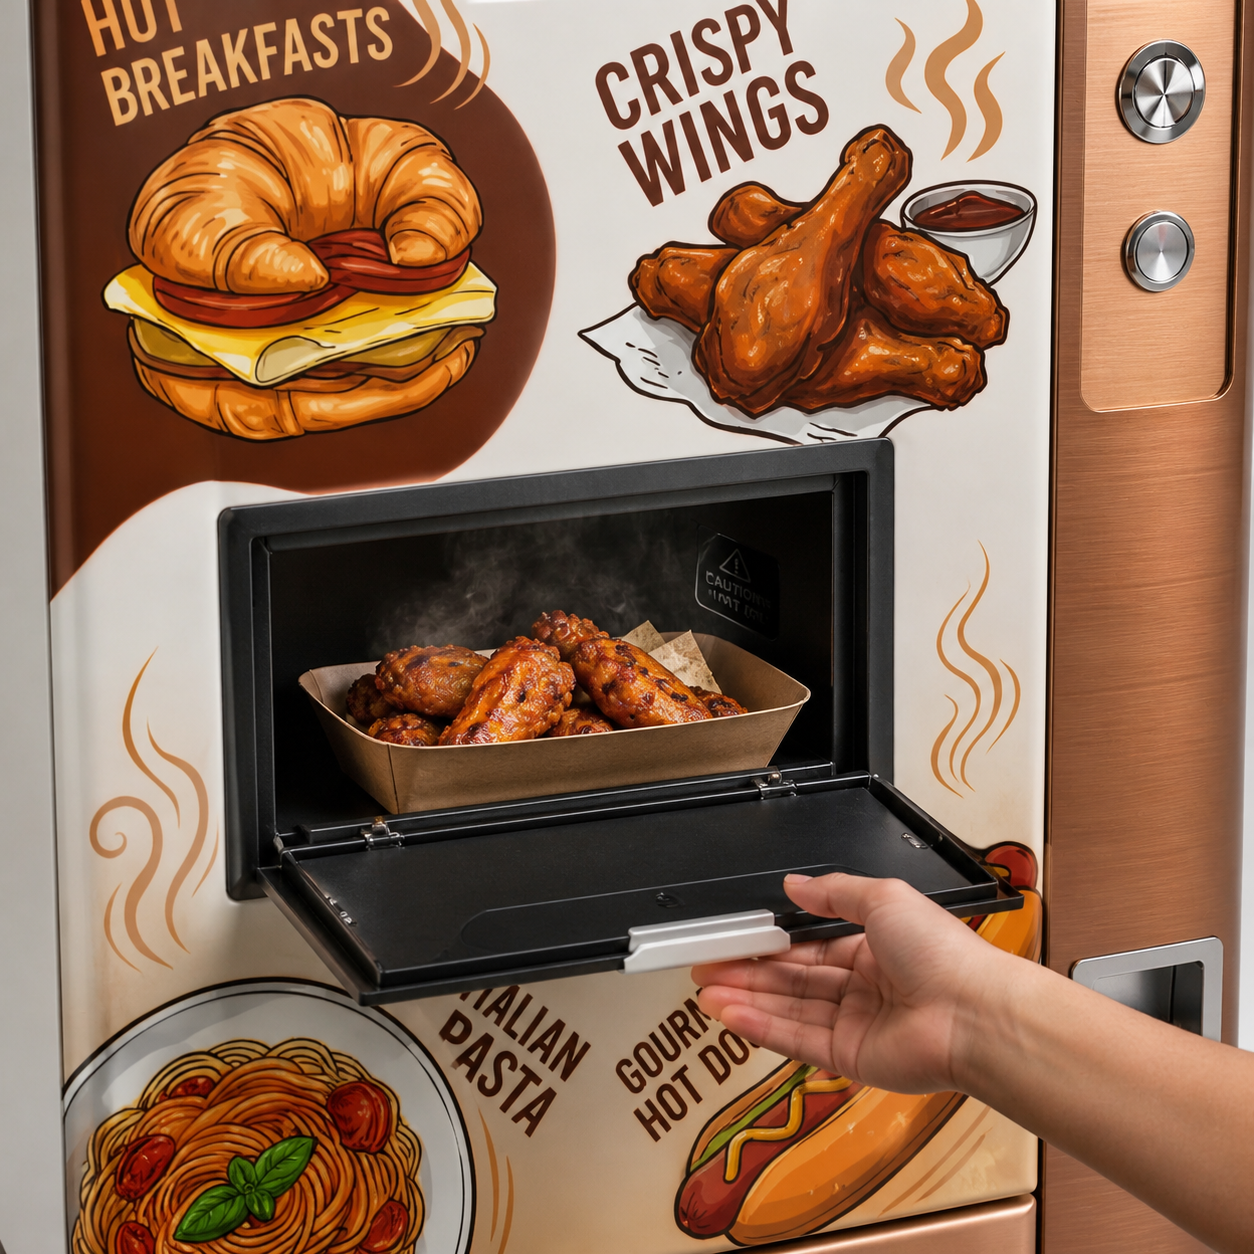
Dinámica de riesgo de los alimentos frescos: Los artículos de comida fresca como sándwiches, wraps y ensaladas tienen precios minoristas de 5,00 a 8,00 dólares. Sin embargo, el producto no vendido caduca en un plazo de 5 a 7 días. Si una máquina vende el 80% de su comida fresca pero se deteriora el 20%, el margen bruto efectivo cae del 50% a menos del 30% una vez que se contabilizan las pérdidas por desperdicio.
-
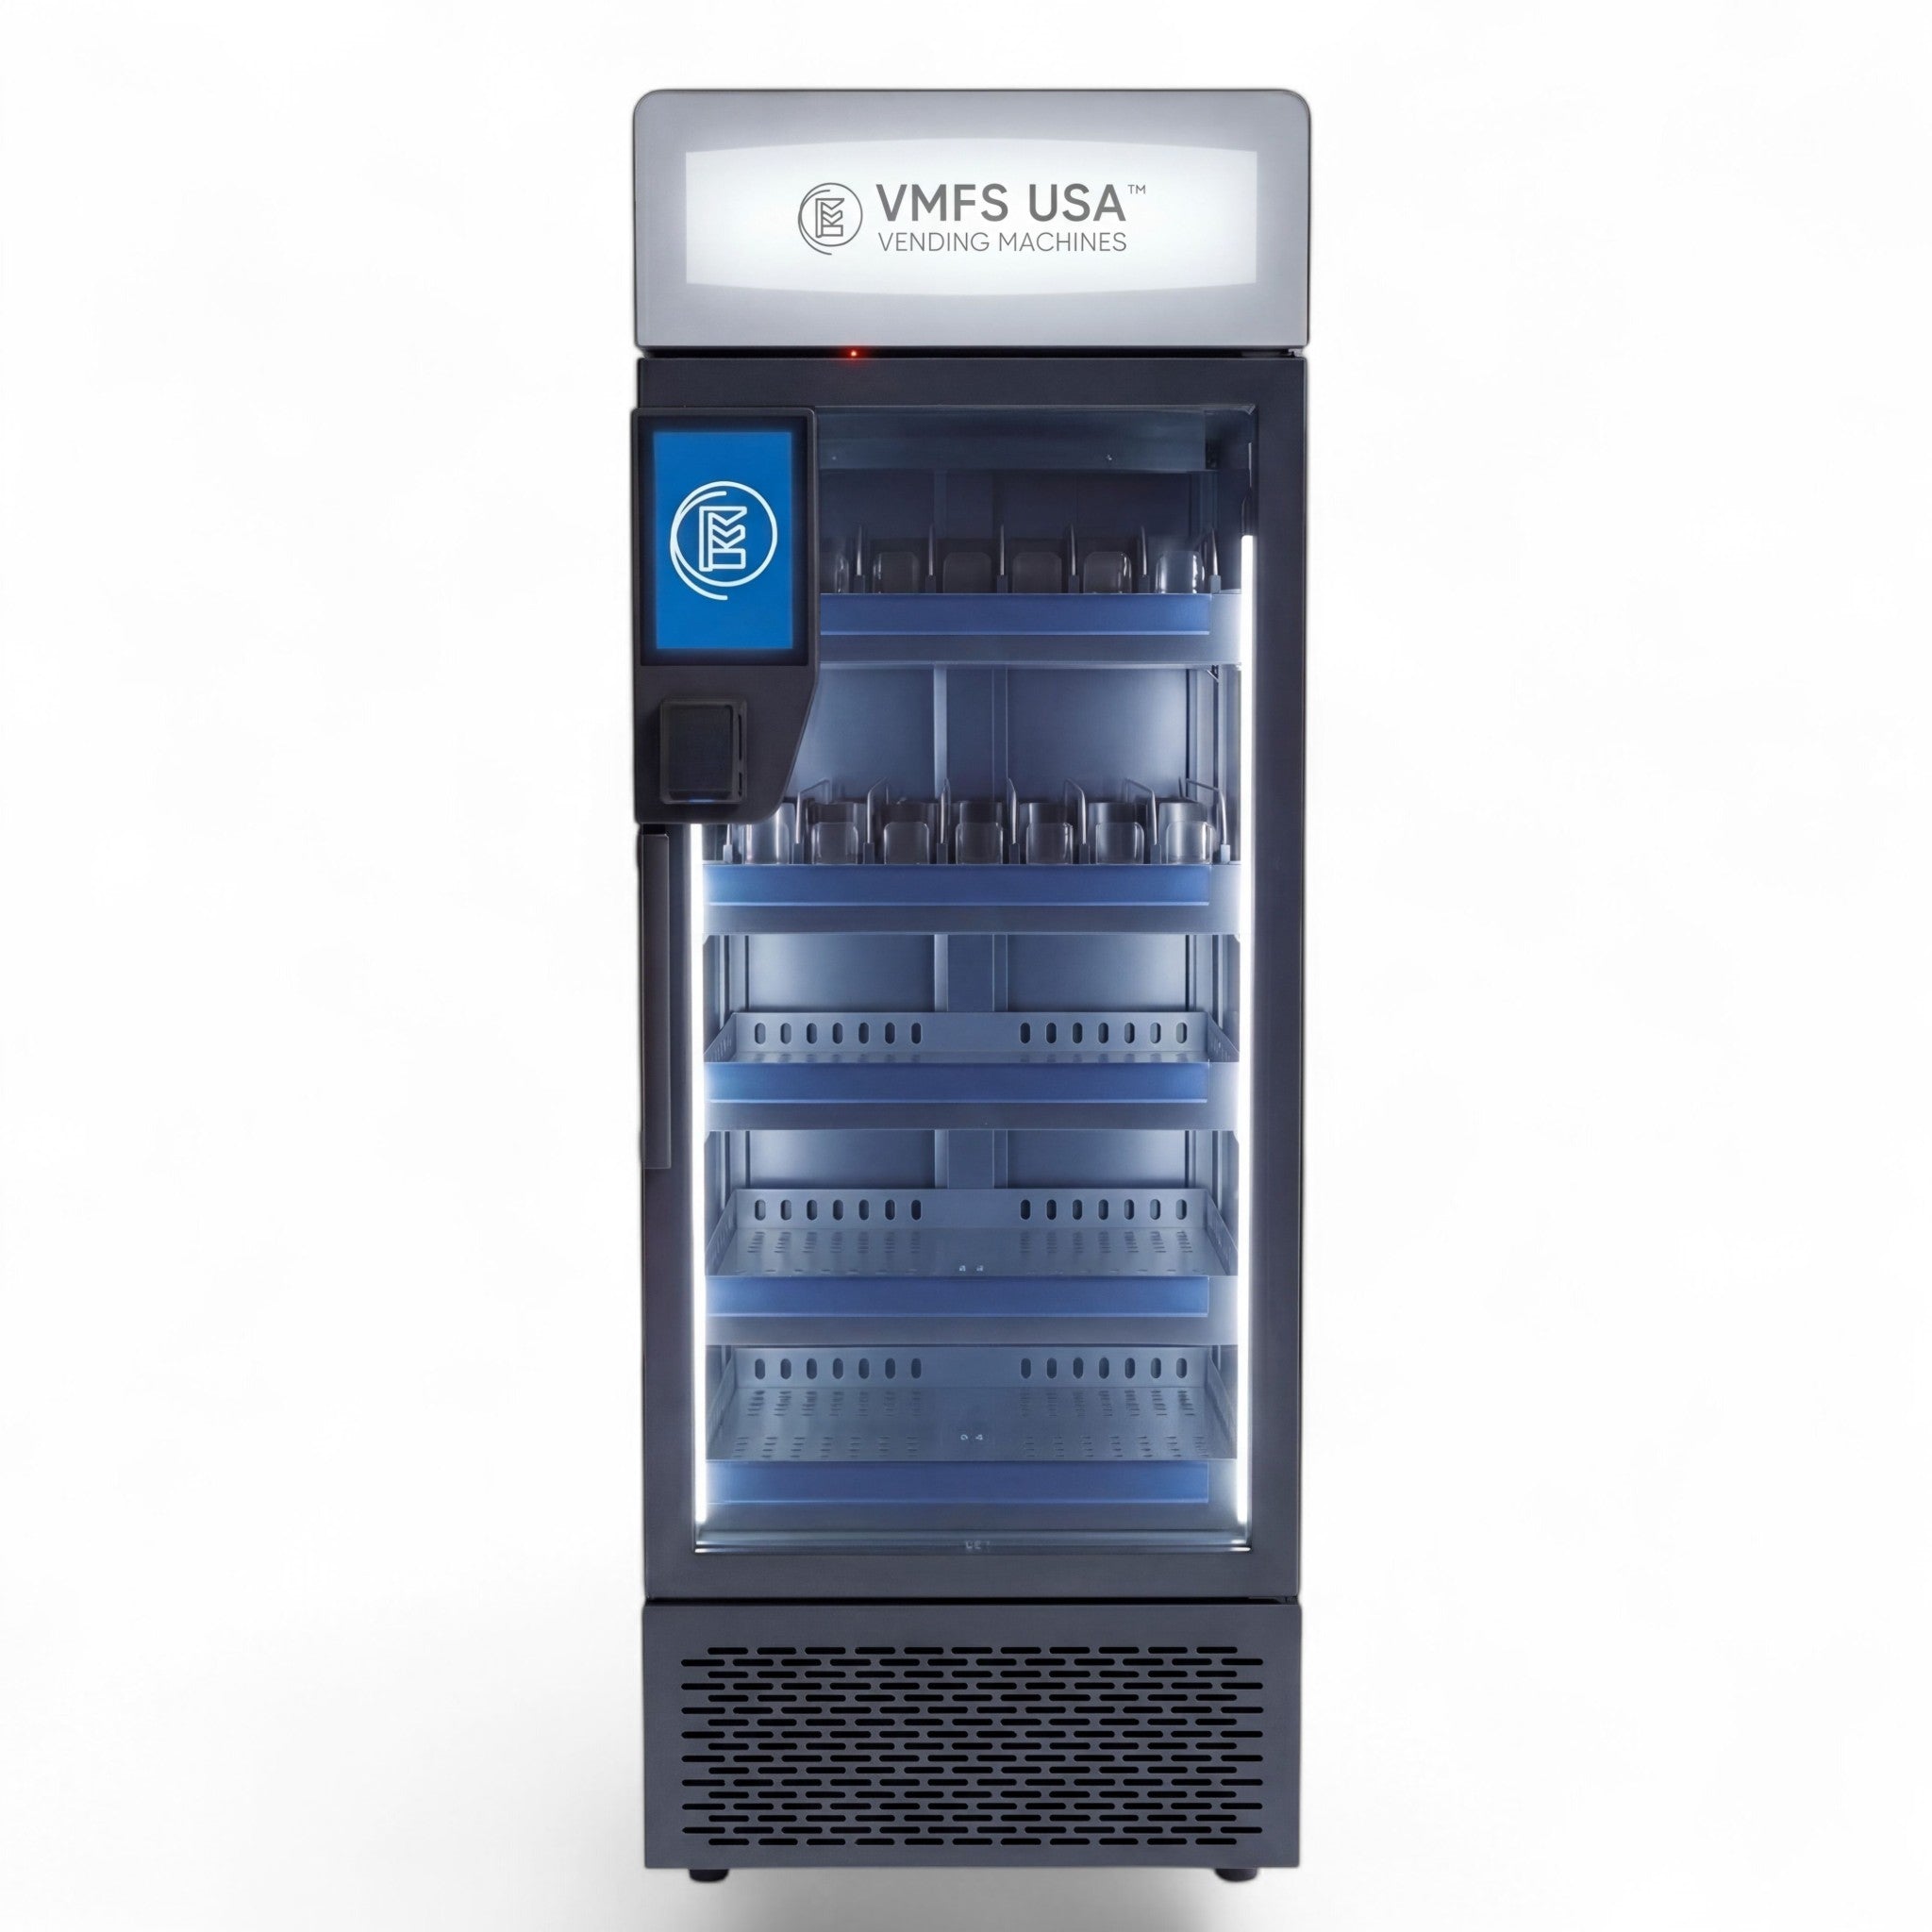
Micro-mercados inteligentes con IA: Los modernos refrigeradores con frente de vidrio equipados con visión por computadora permiten la navegación abierta y el pago de múltiples artículos. Implementar unidades especializadas de la colección de máquinas expendedoras AI grab and go permite a los operadores vender kits de comida premium, bebidas especializadas y artículos frescos con tamaños de cesta más grandes, elevando los valores promedio de pedido (AOV) de 2,00 dólares a más de 7,50 dólares.
Medición del margen de la máquina expendedora por máquina: Modelo de pérdidas y ganancias
El margen neto por máquina mide la cantidad real en dólares retenida por el operador después de deducir todos los gastos operativos y específicos del sitio de los ingresos brutos.
Una máquina que genera 1.000 dólares en ventas brutas mensuales no representa 1.000 dólares en ingresos. Los operadores deben deducir seis niveles de gastos principales para determinar el rendimiento neto real de la máquina:

Comparación integral mensual de pérdidas y ganancias en 4 tipos de máquinas
Para comprender cómo la selección de equipos y la demografía de la ubicación afectan el rendimiento final, revise el estado de pérdidas y ganancias (P&L) mensual comparativo a continuación. Este modelo asume ubicaciones maduras y bien situadas.
| Partida de P&L | Bocadillos ambientales tradicionales | Bebidas frías con frente de vidrio | Unidad de café de grano a taza | Refrigerador inteligente con IA |
| Ingresos brutos mensuales | $850.00 | $1,400.00 | $1,800.00 | $2,600.00 |
| Tamaño promedio del ticket | $1.75 | $2.25 | $2.50 | $5.50 |
| Unidades mensuales vendidas | 485 ventas | 622 ventas | 720 ventas | 472 ventas |
| Costo de bienes vendidos (COGS) | $357.00 (42%) | $448.00 (32%) | $270.00 (15%) | $1,170.00 (45%) |
| Beneficio bruto | $493.00 (58%) | $952.00 (68%) | $1,530.00 (85%) | $1,430.00 (55%) |
| Alquiler/Comisión de ubicación | $85.00 (10%) | $210.00 (15%) | $270.00 (15%) | $390.00 (15%) |
| Tarifas de procesamiento de tarjetas y telemetría | $52.00 (6.1%) | $77.00 (5.5%) | $90.00 (5.0%) | $117.00 (4.5%) |
| Desperdicio, deterioro y contracción | $8.50 (1%) | $7.00 (0.5%) | $36.00 (2%) | $130.00 (5%) |
| Reserva de mantenimiento y saneamiento | $30.00 | $45.00 | $75.00 | $60.00 |
| Asignación de depreciación de equipos | $40.00 | $60.00 | $80.00 | $100.00 |
| Total de gastos operativos mensuales | $215.50 | $399.00 | $551.00 | $797.00 |
| Beneficio neto mensual antes de impuestos | $277.50 | $553.00 | $979.00 | $633.00 |
| Margen de beneficio neto por máquina | 32.6% | 39.5% | 54.4% | 24.3% |
Combinado tradicional de bocadillos y bebidas
Las máquinas combinadas ambientales estándar colocadas en salas de descanso, lavanderías u oficinas pequeñas ofrecen un flujo de caja constante y predecible con una complejidad de mantenimiento mínima.
Debido a que estas unidades no requieren refrigeración activa para el lado de los bocadillos, los costos eléctricos son menores y los riesgos de fallas mecánicas son mínimos. La contrapartida reside en un menor volumen total de ingresos. Las ventas promedio oscilan entre $600 y $1,000 mensuales por máquina. Sin embargo, debido a que el deterioro del inventario es cercano a cero, el porcentaje de margen neto se mantiene saludable, entre el 30% y el 35%.
Los operadores que calculen la inversión inicial en inventario deben consultar nuestra guía sobre cuánto cuesta abastecer una máquina expendedora para evitar una sobrecapitalización en espirales de baja rotación.
Unidades especializadas de café y bebidas calientes
Las máquinas de café operan bajo un modelo financiero excepcional: bajo costo de ventas (COGS), alta velocidad de transacción y precios de venta premium.
Una máquina de grano a taza instalada en la sala de espera de un hospital, un concesionario de automóviles o un centro de llamadas grande suele dispensar de 30 a 50 tazas al día. A un precio promedio de $2.50 por taza, los ingresos mensuales pueden alcanzar los $2,250. Debido a que los costos de los ingredientes representan menos del 15% de los ingresos, la máquina produce un flujo de efectivo neto sustancial ($800 a $1,200/mes) incluso después de contabilizar la mano de obra de limpieza diaria y el mantenimiento del filtro de agua.
Refrigeradores inteligentes con IA y micro-mercados de alta tecnología
Los refrigeradores inteligentes sacrifican márgenes porcentuales ligeramente menores por rendimientos totales en dólares sustancialmente más altos.
Debido a que los clientes pueden comprar múltiples artículos frescos, bebidas gourmet y kits de comida en una sola transacción, el valor promedio de compra aumenta a entre $5.00 y $8.00. Si bien el inventario fresco aumenta el costo de ventas (COGS) al 40%–45% y eleva los riesgos de desperdicio, generar $3,000 en ingresos brutos mensuales con un margen neto del 22% produce $660 en efectivo real, superando a una máquina de bocadillos tradicional que opera con un margen neto del 32% sobre $800 de ingresos brutos ($256 en efectivo).
Factores clave que erosionan los márgenes de la máquina (y cómo solucionarlos)
La erosión del margen ocurre cuando los gastos operativos ocultos drenan efectivo de una ruta sin que el operador lo note activamente. Controlar estos gastos diferencia a los operadores no rentables de los negocios escalables y de alto rendimiento.
Estructuras de comisiones de ubicación y reparto de ingresos
Las comisiones de ubicación representan la tarifa que se paga a los propietarios por el privilegio de colocar equipos en sus instalaciones. Las tasas de comisión altas comprimen directamente los márgenes netos.
Pagar una comisión del 15% o 20% sobre una máquina que genera $800 al mes resta directamente entre $120 y $160 de su beneficio neto. En muchos casos, esto transfiere hasta la mitad de las ganancias netas reales del operador al propietario del inmueble.
-
Alquiler fijo frente a reparto porcentual: Negocie un alquiler mensual fijo por el espacio ($50/mes) en lugar de comisiones porcentuales siempre que sea posible. En ubicaciones de alto volumen ($1,500+/mes), el alquiler fijo aumenta drásticamente los márgenes netos del operador a medida que crece el volumen.
-
Estructuras de comisiones escalonadas: Establezca umbrales en los que las comisiones solo se activen después de cumplir con los objetivos básicos de ventas (por ejemplo, 0% de comisión en los primeros $500 de ventas mensuales; 10% sobre los ingresos brutos que excedan los $500).
-
Propuestas de comisión cero: Presente la máquina expendedora como un beneficio para los empleados en lugar de un centro de ganancias para el propietario del sitio. Muchas oficinas corporativas, almacenes y centros de distribución firmarán con gusto contratos de comisión cero para ofrecer opciones convenientes de comida y bebida a su fuerza laboral.
Revise los marcos de contratación estándar de la industria en nuestro desglose sobre el reparto de ingresos de la máquina expendedora entre operador, ubicación y proveedor antes de firmar acuerdos de propiedad.
Procesamiento de pagos y gastos generales de telemetría
La aceptación de pagos sin efectivo es necesaria para el vending moderno, pero las tarifas de procesamiento mercantil no optimizadas pueden erosionar los márgenes de la unidad en artículos de bajo precio.
Los procesadores de tarjetas de crédito cobran una combinación de una tarifa porcentual (generalmente del 2.5% al 3.5%) más una tarifa de transacción fija ($0.05 a $0.10 por uso), junto con tarifas mensuales de conexión de telemetría ($6.00 a $10.00 por máquina).
Para proteger los márgenes de los artículos contra la erosión de las tarifas comerciales:
-
Implemente precios de dos niveles: Cobre una tarifa de conveniencia de $0.10 a $0.15 en las transacciones con tarjeta de crédito para compensar los costos de procesamiento, o asigne a todos los productos básicos precios lo suficientemente altos como para absorber la estructura de tarifas sin problemas.
-
Habilite funciones de venta múltiple: Los lectores de tarjetas modernos permiten a los clientes seleccionar varios artículos bajo una sola autorización de tarjeta, consolidando dos o tres compras en una sola tarifa de procesamiento fija.
-
Audite el hardware de telemetría: Asegúrese de que su proveedor de hardware sin efectivo utilice tasas de intercambio de primer nivel optimizadas específicamente para el comercio minorista automatizado de bajo costo.
Deterioro, desperdicio y merma
El deterioro se refiere al inventario que llega a su fecha de vencimiento antes de ser vendido. La merma se refiere al inventario perdido debido a robos internos en la ruta, errores de venta de la máquina o intrusiones físicas.
Una tasa de desperdicio del 5% en una ruta que genera $20,000 en ventas mensuales representa una pérdida directa de $1,000 mensuales en flujo de caja neto.
Los operadores pueden eliminar el desperdicio mediante la gestión de telemetría en la nube. Al usar software de monitoreo remoto en tiempo real para evaluar la velocidad del producto, los operadores pueden ajustar las asignaciones de columnas antes de que los productos se deterioren. La implementación de prácticas estructuradas para el seguimiento del inventario de la máquina expendedora garantiza que los artículos de alta rotación ocupen el espacio principal de las espirales, mientras que los productos de movimiento lento se eliminan sistemáticamente.
Prevenir el tiempo de inactividad mecánico inesperado también preserva los márgenes de beneficio. Presupuestar para el mantenimiento rutinario de la máquina expendedora evita costosas reparaciones de emergencia y evita el deterioro del inventario causado por fallas en la unidad de enfriamiento.
Marco estratégico: cómo optimizar la mezcla de productos para obtener el máximo rendimiento
Maximizar el margen por máquina requiere estructurar la selección de productos utilizando una estrategia de inventario basada en datos en lugar de preferencias personales de alimentos.
El marco de asignación de productos 70 / 20 / 10
-
70% Motores de velocidad central: Asigne el 70% de la capacidad de la máquina a artículos probados y de alta demanda (por ejemplo, papas fritas de marca, refrescos, agua con gas). Estos productos tienen márgenes moderados (50%–60%) pero impulsan el tráfico básico y pagan los gastos generales fijos de la máquina.
-
20% Impulsores de alto margen: Dedique el 20% de la capacidad a generadores de margen premium (por ejemplo, bebidas energéticas, cafés helados, palitos de carne especializados). Estos productos tienen márgenes del 65% al 80% y elevan los valores promedio de transacción.
-
10% Productos de temporada / comodín: Use el 10% restante del espacio para probar nuevas tendencias del mercado (por ejemplo, bocadillos importados, bebidas deportivas de nicho, dulces únicos). Rote los artículos de prueba de bajo rendimiento cada 30 días.

Matriz de decisiones para el ajuste de inventario de bajo frente a alto margen
Al analizar los informes de rendimiento del producto a través de telemetría, utilice esta matriz operativa para ajustar su mezcla de productos:
| Perfil de rendimiento | Velocidad de ventas | % Margen bruto | Acción requerida | Ejecución operativa |
| Estrellas | Alta | Alta (> 65%) | Expandir capacidad | Duplique la capacidad de la espiral para evitar falta de stock entre visitas de reabastecimiento. |
| Vacas lecheras | Alta | Moderada (45%-55%) | Mantener y optimizar | Mantenga el inventario abastecido; pruebe pequeños aumentos de precio de $0.10–$0.25. |
| Trampas de alto margen | Baja | Alta (> 70%) | Reposicionar / Promocionar | Mueva el producto a espirales al nivel de los ojos o actualice las etiquetas promocionales visuales. |
| Peso muerto | Baja | Baja (< 45%) | Eliminar inmediatamente | Descontinúe el producto; reemplácelo con un artículo de alta demanda o expanda las Estrellas. |
Los operadores que buscan escalar su ruta pueden aplicar principios basados en datos para usar números reales para escalar de manera más inteligente, ampliando la capacidad de la ruta basándose en retornos de efectivo predecibles.
Para obtener asesoramiento especializado sobre precios dinámicos sin alienar a los clientes, lea nuestra guía sobre cómo fijar precios para obtener ganancias.
Plan de acción final para operadores
Construir una operación de vending rentable requiere una gestión continua tanto de la economía de los artículos como de los gastos generales de la máquina.
Comience auditando el desempeño actual de su ruta: calcule el costo de ventas (COGS) mayorista exacto de cada producto en su almacén, ajuste los precios minoristas para protegerse contra las tarifas de procesamiento de tarjetas y negocie acuerdos de ubicación de alquiler fijo o comisión cero siempre que sea posible. Al eliminar el inventario muerto, ampliar las selecciones de alto margen como bebidas frías y café, y mantener un control estricto sobre el desperdicio, transformará las máquinas expendedoras individuales en activos de flujo de efectivo predecibles a largo plazo.
Puntos clave
-
Realidades brutas frente a netas: Los altos márgenes de beneficio a nivel de artículo (200%–400%) no equivalen a altos beneficios de la máquina; los gastos operativos como las comisiones de ubicación (10%–20%) y las tarifas comerciales (5%–7% en boletos pequeños) comprimen significativamente los márgenes netos.
-
Principales impulsores de margen: El café, las bebidas frías a granel y los productos especializados (como medicamentos de venta libre o electrónica) ofrecen el mayor beneficio bruto por artículo, superando a menudo el 70%.
-
El rendimiento de la máquina varía ampliamente: Una máquina de bocadillos estándar promedia $150–$300 de beneficio neto mensual, mientras que una máquina de café de alto tráfico o un refrigerador inteligente con IA puede generar $600–$1,500+ de beneficio neto mensual.
-
El deterioro destruye el flujo de caja: Los alimentos frescos pueden mostrar un margen de papel atractivo del 60%, pero una tasa de desperdicio/deterioro del 20% reduce el beneficio neto real por debajo del de los bocadillos de estante estables.
-
La elasticidad de los precios importa: Aumentar los precios de los artículos en $0.25 a $0.50 genera un aumento casi inmediato del 10%–15% en el beneficio neto de la máquina sin afectar notablemente el volumen total de transacciones en ubicaciones cautivas.
Preguntas frecuentes
¿Cuál es un buen margen de beneficio bruto para un negocio de máquinas expendedoras?
Un buen margen de beneficio bruto para un negocio de máquinas expendedoras oscila entre el 55% y el 70% en toda la cartera de rutas. Las bebidas y los artículos de café elevan el promedio, mientras que las papas fritas de marca y los alimentos frescos lo reducen.
¿Cuánto beneficio neto genera una sola máquina expendedora al mes?
Una sola máquina expendedora genera un beneficio neto promedio de $150 a $400 por mes para las unidades de bocadillos ambientales estándar, mientras que las máquinas de bebidas frías, café caliente o máquinas inteligentes con IA de alto tráfico pueden generar de $500 a $1,200+ de beneficio neto mensual. La calidad de la ubicación, el tráfico peatonal, la mezcla de productos y las estructuras de comisiones dictan el rendimiento final.
¿Cómo afectan las comisiones de ubicación al margen general de la máquina?
Las comisiones de ubicación actúan como una deducción directa de los ingresos brutos, comprimiendo significativamente los márgenes netos. Pagar una comisión bruta del 15% sobre una máquina con un margen neto del 25% reduce sus ganancias netas reales en un 60%, lo que hace que los contratos de baja comisión o alquiler fijo sean vitales para la rentabilidad.
¿Qué artículos de máquinas expendedoras ofrecen el margen de beneficio más alto?
El café caliente, las bebidas frías a granel (latas y agua embotellada), los medicamentos de venta libre y los productos electrónicos especializados ofrecen los márgenes de beneficio por artículo más altos. El café encabeza todas las categorías, con costos de ingredientes que a menudo representan menos del 15 % del precio minorista.
¿Cómo afectan las comisiones de procesamiento de tarjetas de crédito a los márgenes de las máquinas expendedoras?
Las comisiones de procesamiento de tarjetas de crédito afectan los márgenes al aplicar una tarifa fija ($0.05–$0.10) más un porcentaje (2.5 %–3.5 %) por transacción, lo cual perjudica desproporcionadamente a los artículos de bajo costo por debajo de $1.50. Los operadores mitigan esta erosión trasladando pequeñas tarifas tecnológicas o estableciendo precios minoristas base más altos.
Compartir:
Cuándo contratar a una segunda persona para operaciones: Plan de escala de rutas de máquinas expendedoras
Programación y rutas de reabastecimiento de máquinas expendedoras: Guía del operador