


AI vending machine profit margins range from 35% for fresh food to over 75% for coffee and packaged beverages, with the exact figure driven by ingredient cost, shelf life, and how much of the transaction value each product commands. Coffee delivers the highest margin percentage in the category, typically 60% to 75%, because ingredient cost per cup stays low while price tolerance stays high. Fresh food carries the lowest percentage margin but the highest absolute profit per sale, since a $6 to $12 meal at 35% to 50% margin outearns a $1 snack at 70% margin on a per-transaction basis. This guide breaks down real margin data by product category so operators can build a mix that maximizes profit per machine, not just percentage on paper.
Table of Contents
- Why Profit Margins Vary by Product Type
- AI Vending Profit Margins by Category
- Coffee: The Highest-Margin Category
- Beverages and Bottled Drinks
- Packaged Snacks and Confections
- Fresh Food and Grab-and-Go Meals
- Healthy and Premium Products
- Margin Percentage vs. Absolute Profit
- Matching Product Mix to Location
- Which Machine Fits Which Margin Strategy
- Frequently Asked Questions
Why Profit Margins Vary by Product Type
Cost of Goods Drives the Percentage
Margin percentage moves inversely with ingredient and packaging cost relative to sale price: a product costing $0.14 that sells for $1.00 clears an 86% margin, while a $6 meal built from $3 to $4 of fresh ingredients clears closer to 40%. Product cost runs roughly 50% of selling price as a general rule across vending, but water and premium beverages regularly beat that benchmark by a wide margin because their input cost stays near zero.
Shelf Life and Waste Risk Offset High Margins
A high percentage margin does not guarantee high profit if the product expires unsold. Fresh, refrigerated, and specialty items require tighter inventory control because expired stock silently erodes the margin advantage that made the category attractive in the first place. This is precisely where AI vending machines outperform coil-based units, since how AI vending machines work includes real-time sell-through tracking that flags slow-moving perishables before they expire.
Build a product mix around real margin data, not guesswork.
Shop AI Grab-and-Go MachinesAI Vending Profit Margins by Category
Category-Level Margin Comparison
Margin percentage alone can mislead a new operator into over-indexing on candy and under-stocking meals, so the table below pairs typical gross margin with the transaction context that actually determines monthly profit.
| Product Category | Typical Gross Margin | Avg. Transaction Value |
|---|---|---|
| Coffee / hot beverages | 60–75% | $2.50–$5 |
| Bottled water / cold beverages | 64–86% | $1–$2.50 |
| Packaged snacks / candy | 45–76% | $0.50–$1.50 |
| Healthy snacks / protein bars | 35–50% | $2–$4 |
| Fresh food / grab-and-go meals | 35–50% | $6–$12 |
| Traditional combo (snack + drink) | 40–60% | $1–$3 |
The full cost side of this equation — what each AI machine format costs to buy and run — is broken down in the AI vending machine cost guide, since margin percentage only matters against a hardware and operating cost baseline that varies by machine type.
Coffee: The Highest-Margin Category
Why Coffee Outperforms on Margin Percentage
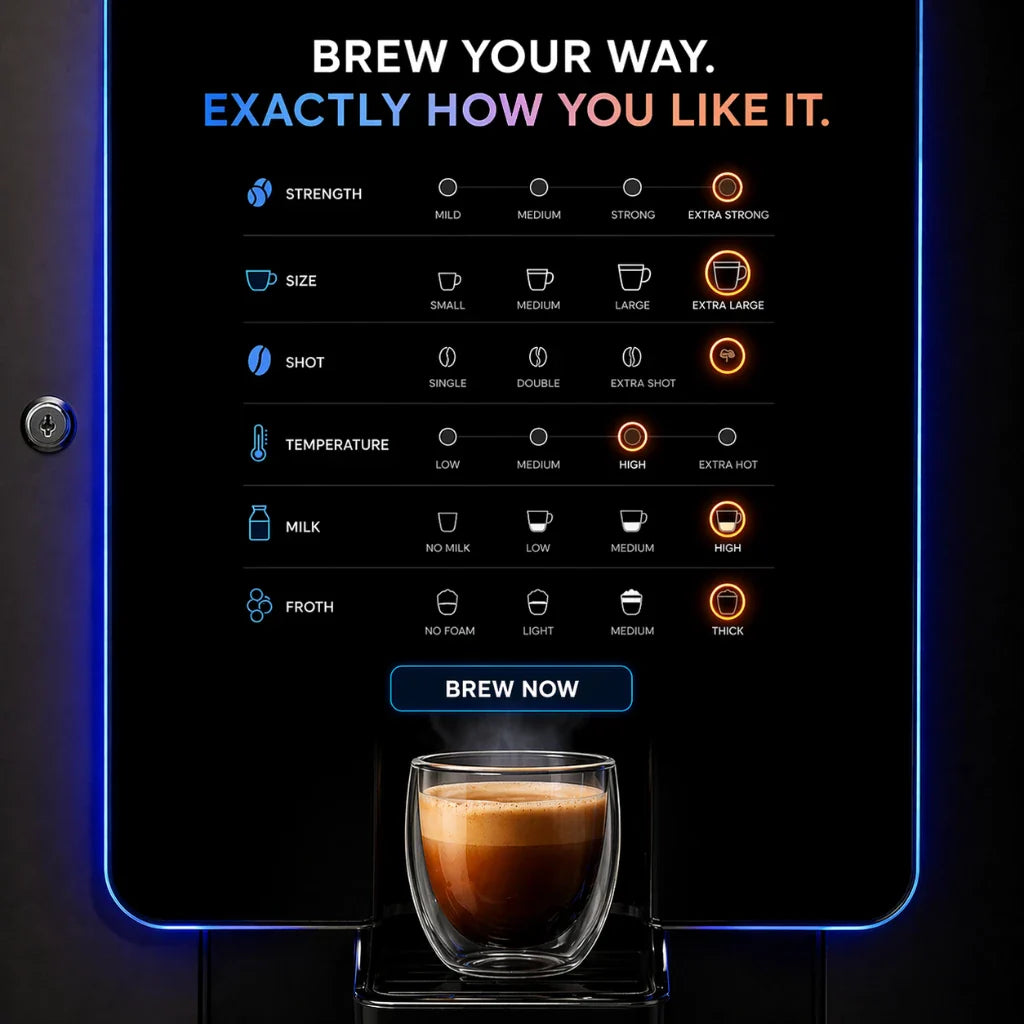
Coffee delivers the highest margins in vending, typically 60% to 75%, because ingredient cost per cup stays low while daily repeat-purchase behavior keeps demand steady regardless of season. Customization — size, milk type, flavor shots — also supports upsell pricing that lifts average transaction value without a proportional increase in cost.
Where the Cost Trade-Off Shows Up
Coffee machines are among the more expensive units to purchase and maintain relative to a standard combo, so the higher margin percentage has to offset a larger upfront and ongoing cost base before it produces a meaningfully higher net profit. That trade-off is why coffee performs best in locations with genuine daily repeat traffic — offices, waiting areas, transit hubs — rather than low-frequency sites where the equipment cost cannot be recovered quickly.
Compare live coffee-focused hardware directly in the coffee vending machine collection.
Beverages and Bottled Drinks
Water and Cold Drinks Post the Widest Margins in the Machine
A 16 oz. bottle of water costing roughly $0.14 and selling for $1.00 produces an 86% margin, the single widest margin of any common vending category, because the input cost is close to zero while price tolerance stays consistent across almost every location type. Branded energy drinks and premium beverages hold slightly thinner but still strong margins, often 43% to 64%, and combine that margin with strong unit velocity.
Beverages Anchor Total Machine Revenue
Beverages typically account for 40% to 50% of total vending sales, which makes them the volume engine of the machine even when individual snack items post a higher margin percentage. High turnover multiplied by strong margin is why beverages consistently anchor profitable product mixes across nearly every location category.
Packaged Snacks and Confections
Candy and Salty Snacks Carry Strong Individual Margins
Fruit snacks costing $0.12 and selling for $0.50 yield a 76% margin, granola bars post 72%, and gummy bears reach 70%, making confections some of the highest-margin-percentage items available in any machine. Chips post roughly 55% margin and chocolate bars in the 46% to 53% range, still well above the fresh food category despite their much lower price point.
Why Percentage Alone Overstates Their Value
Because snack transaction values sit between $0.50 and $1.50, a machine leaning too heavily on candy generates a high blended margin percentage but a comparatively low absolute profit per visit. Operators who replace roughly one-third of low-margin filler snacks with premium or healthy alternatives see total sales lift 30% to 40%, since the higher price point on premium items outweighs the modest cost increase.
Fresh Food and Grab-and-Go Meals
Lower Percentage, Higher Dollar Profit
Fresh food and grab-and-go meals carry the lowest margin percentage in the category, typically 35% to 50%, because ingredient cost, refrigeration, and shorter shelf life all cut into the spread. But because the average sale ranges from $6 to $12 rather than $1, a single fresh food transaction can generate more absolute profit than five snack sales combined, which is why fresh food remains one of the strongest categories for total machine revenue despite its thinner percentage.
Waste Management Determines Real-World Margin
The gap between theoretical and realized margin in fresh food comes almost entirely from waste. AI vending's real-time inventory tracking directly addresses this by flagging near-expiration stock for dynamic discounting before it becomes a total loss, a capability explained further in how AI-powered vending machines optimize sales.
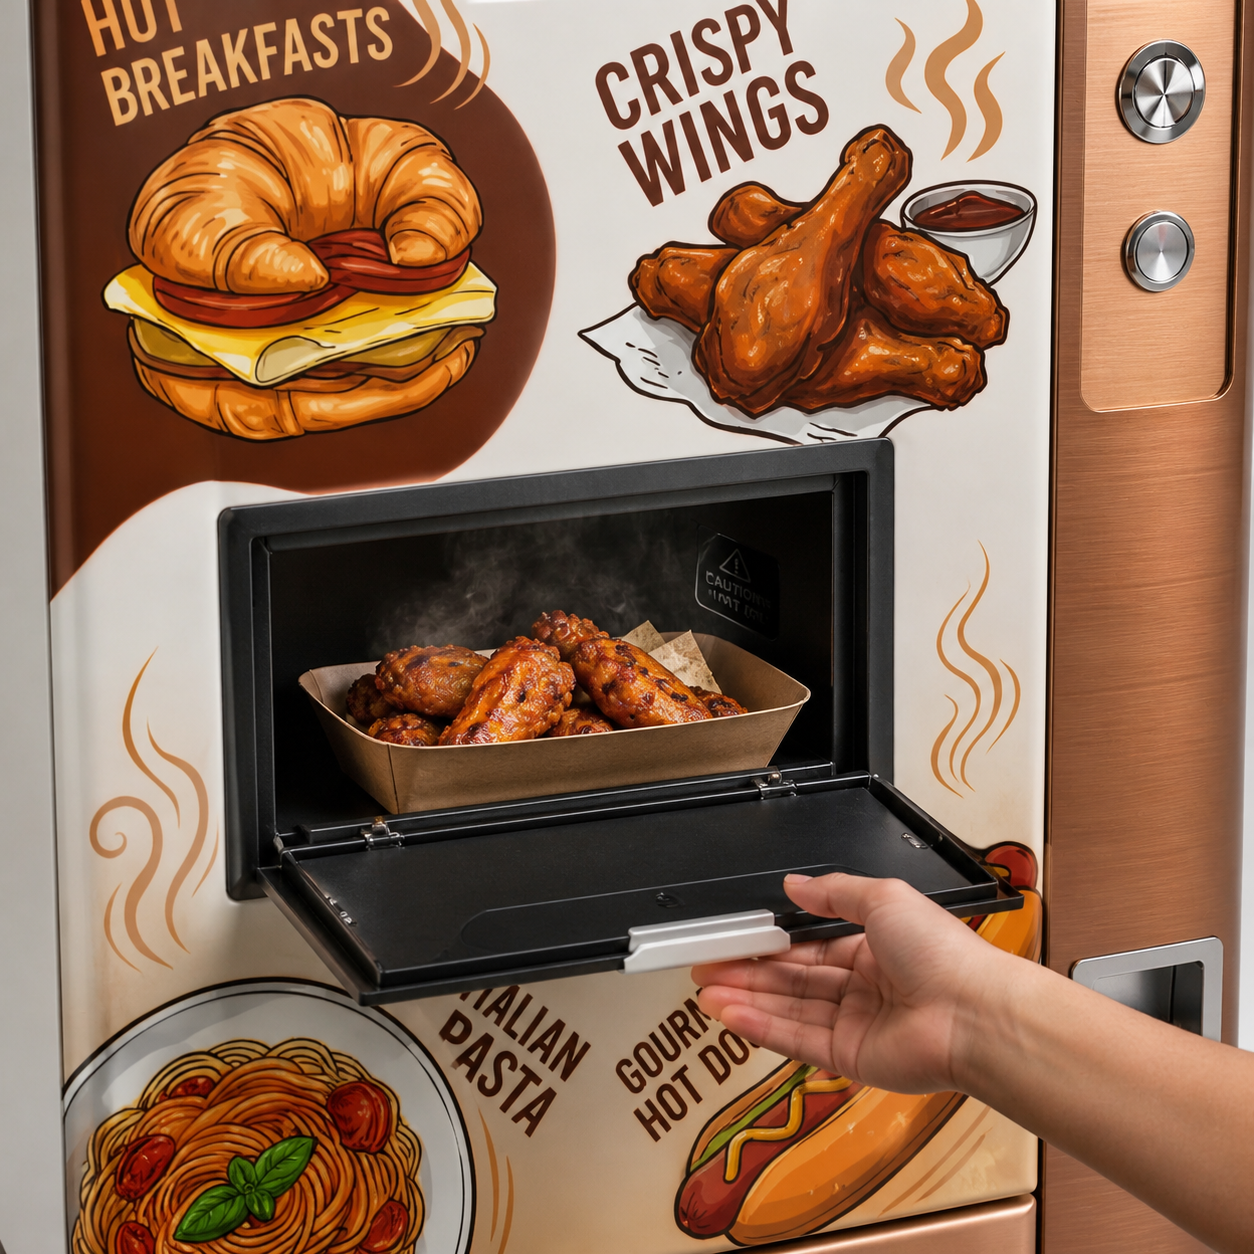
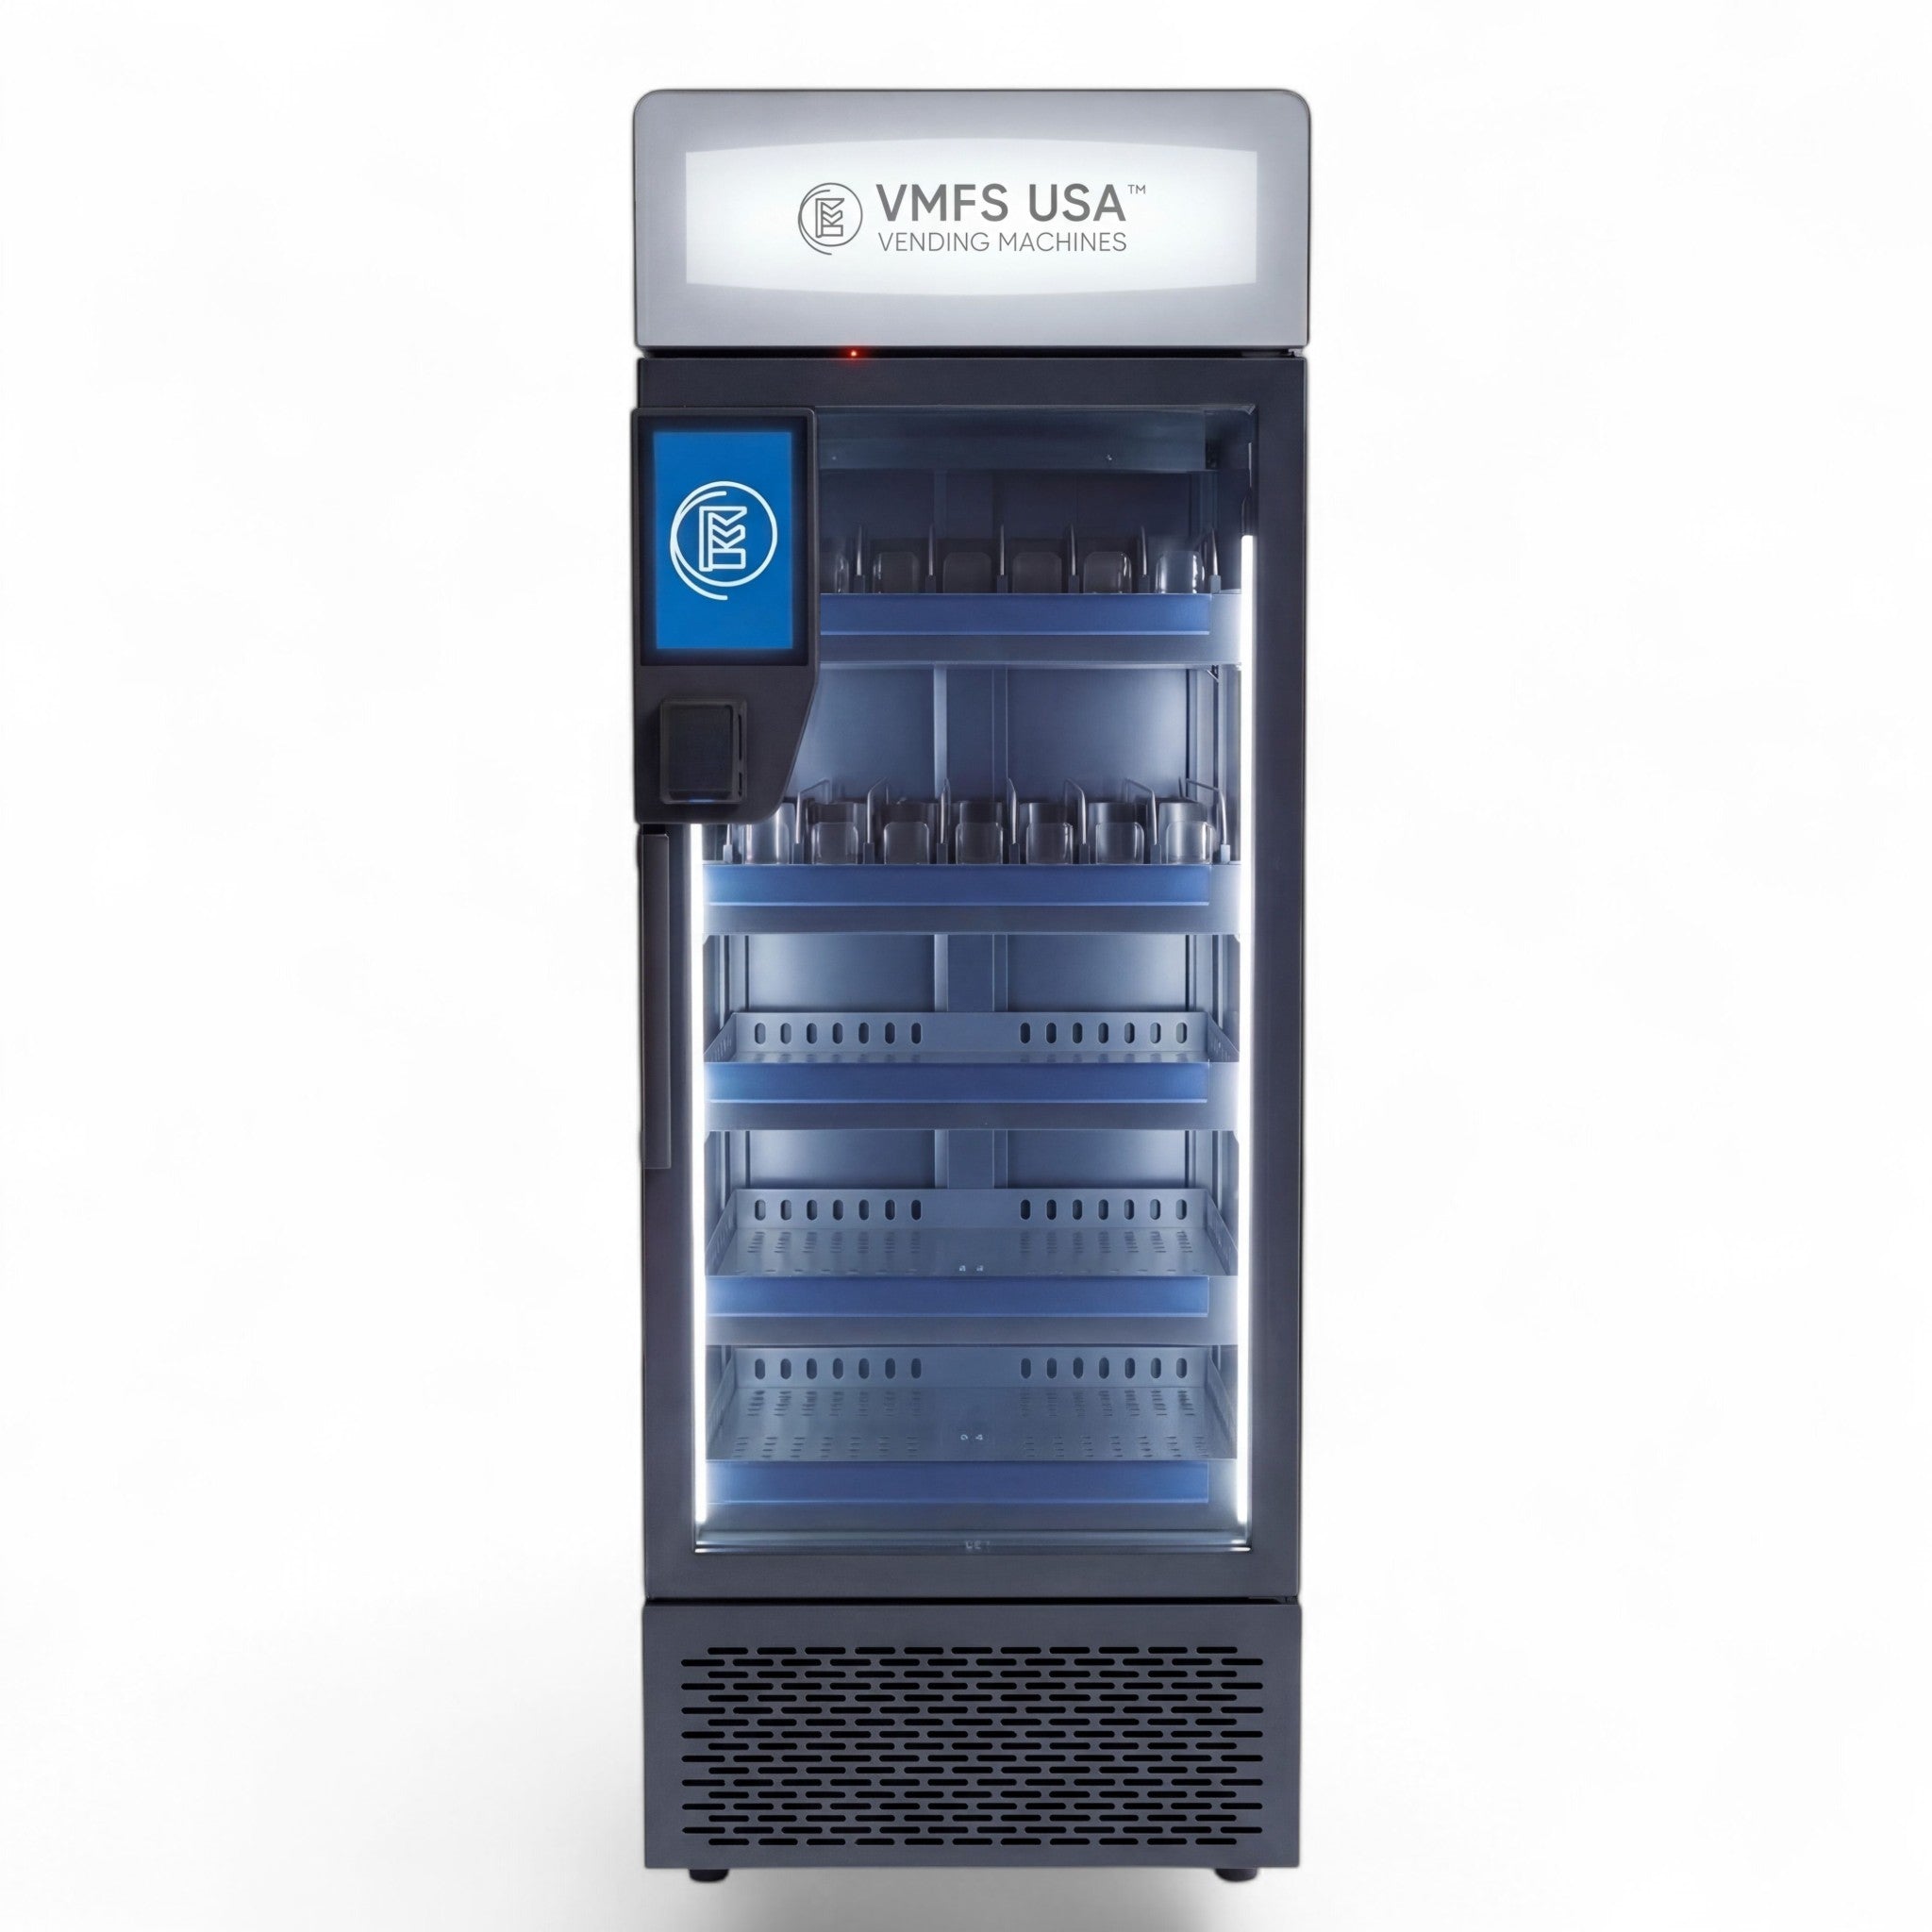
Fresh food formats are best served by the Smart Fridge Vending Machine, which is purpose-built for refrigerated, perishable inventory.
Selling fresh meals or refrigerated items? See the right machine for that margin profile.
View Smart Fridge Vending MachineHealthy and Premium Products
Wellness-Aligned Products Support Higher Pricing
Healthy vending machine products often perform well in offices, hospitals, gyms, and schools because demand aligns with wellness goals, and that alignment reduces direct price competition even when overall unit volume stays flat. Protein bars, healthy snacks, and functional beverages command premium pricing tolerance in the right demographic, which lifts absolute margin even when the percentage sits closer to 35% to 50% rather than the 70%-plus seen in candy.
Premiumization Is a 2026 Trend, Not a Niche
Consumers increasingly pay more for artisanal, functional, and clean-ingredient products, which means premium positioning is becoming a mainstream margin lever rather than a specialty tactic reserved for boutique locations. This trend connects directly to the AI vending category's growth story, covered in AI vending's role in smart cities and sustainability.
Pros of High-Margin-Percentage Items (Coffee, Candy, Water)
Low ingredient cost, long shelf life, minimal waste risk, and strong per-unit margin that tolerates pricing flexibility without eroding profit.
Cons of High-Margin-Percentage Items Alone
Low transaction value caps total machine revenue, and an over-reliance on candy or snacks limits appeal to health-conscious demographics in offices and gyms.
Margin Percentage vs. Absolute Profit
Why GMROI Matters More Than Margin Alone
Gross Margin Return on Investment measures gross profit earned per dollar invested in inventory, and it exposes why a high-margin item that sells slowly can underperform a lower-margin item that turns over quickly. A candy bar bought for $0.50 and sold for $2.00 nets $1.50 profit; at 50 units a week, that is $75 profit against a $25 inventory spend, a strong return that a slower-moving premium item might not match even at a higher margin percentage.
Blending Both Metrics Into a Product Strategy
The strongest AI vending product mixes combine fast-turning, high-margin staples like beverages and packaged snacks with a smaller allocation of higher-ticket fresh food or coffee items, because the staples fund consistent cash flow while the premium items lift total revenue per visit. Real-world evidence of this blended strategy is covered in the case study on finding the sweet spot for AI vending machines.
Matching Product Mix to Location
Benchmark Mixes by Location Type
Industry benchmark product mixes vary meaningfully by venue: office buildings typically run 40% beverages, 35% healthy snacks, 15% coffee or tea, and 10% miscellaneous, while gyms shift toward 40% protein bars and shakes, 30% sports drinks, 20% healthy snacks, and 10% supplements. Hospitals lean into 30% grab-and-go meals and 35% beverages, and universities balance 35% snacks with 25% energy drinks and 20% each of coffee and meals.
| Location Type | Recommended Product Mix Emphasis |
|---|---|
| Office buildings | Beverages, healthy snacks, coffee |
| Gyms and fitness centers | Protein bars, sports drinks, healthy snacks |
| Hospitals | Grab-and-go meals, beverages, OTC items |
| Universities | Snacks, energy drinks, coffee, meals |
A full framework for scoring location traffic and demand data before finalizing a product mix is available in AI vending machine location data, and a side-by-side look at how AI margins compare against traditional coil-based machines is covered in traditional vs. AI vending machines.
Which Machine Fits Which Margin Strategy
Beverage and Combo-Focused Formats
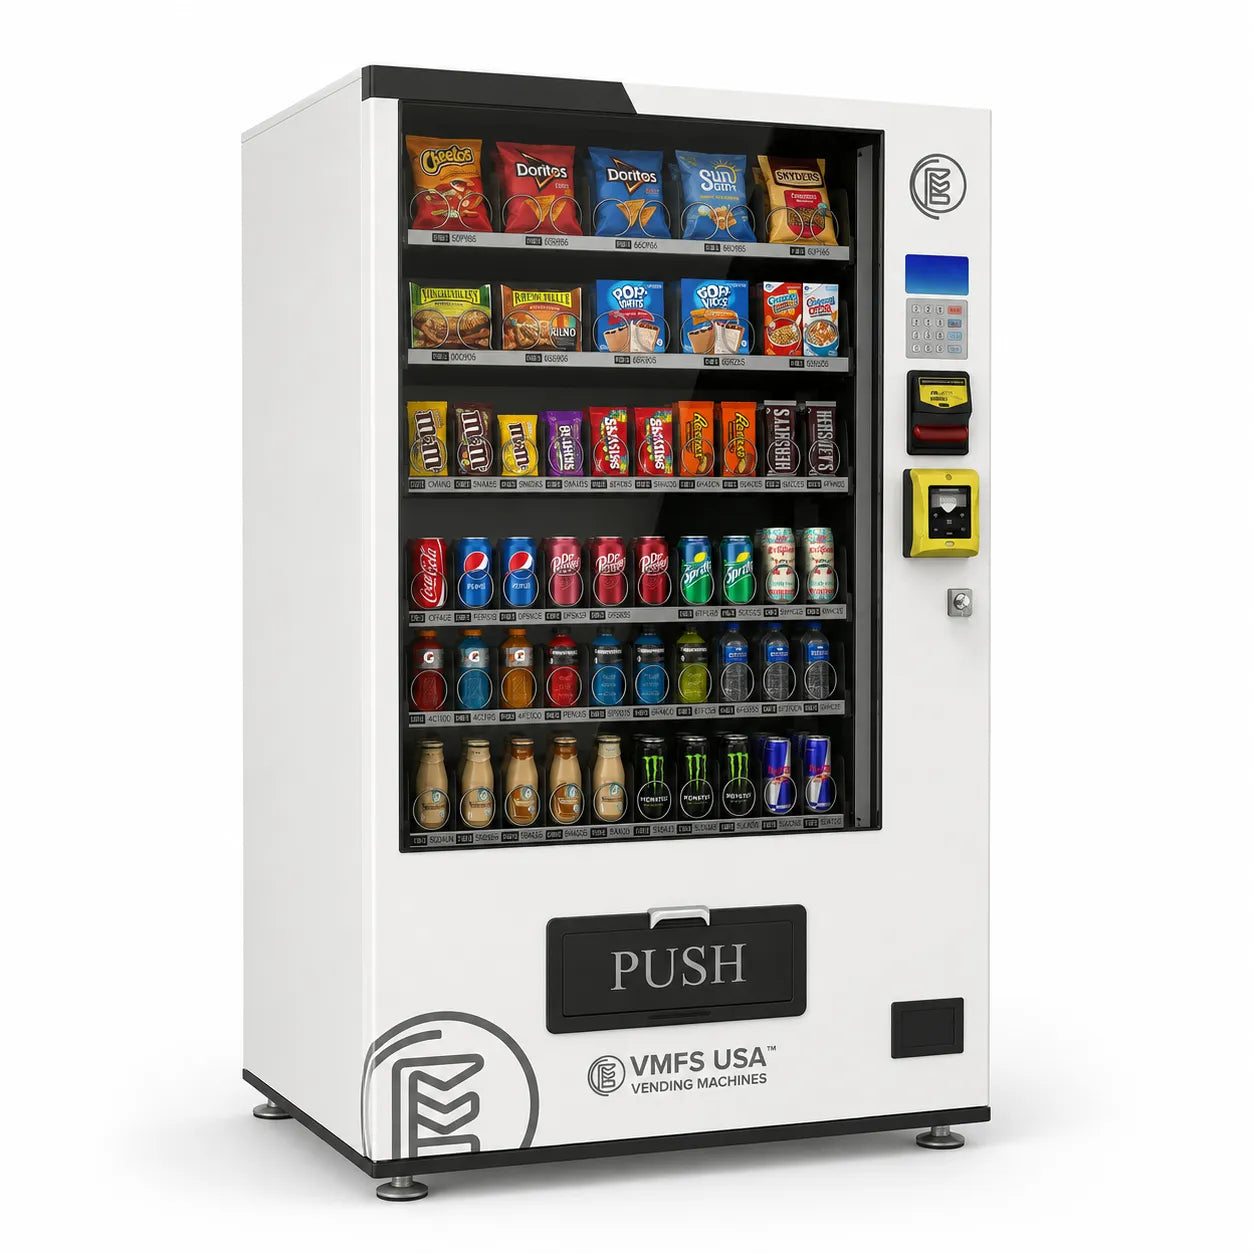
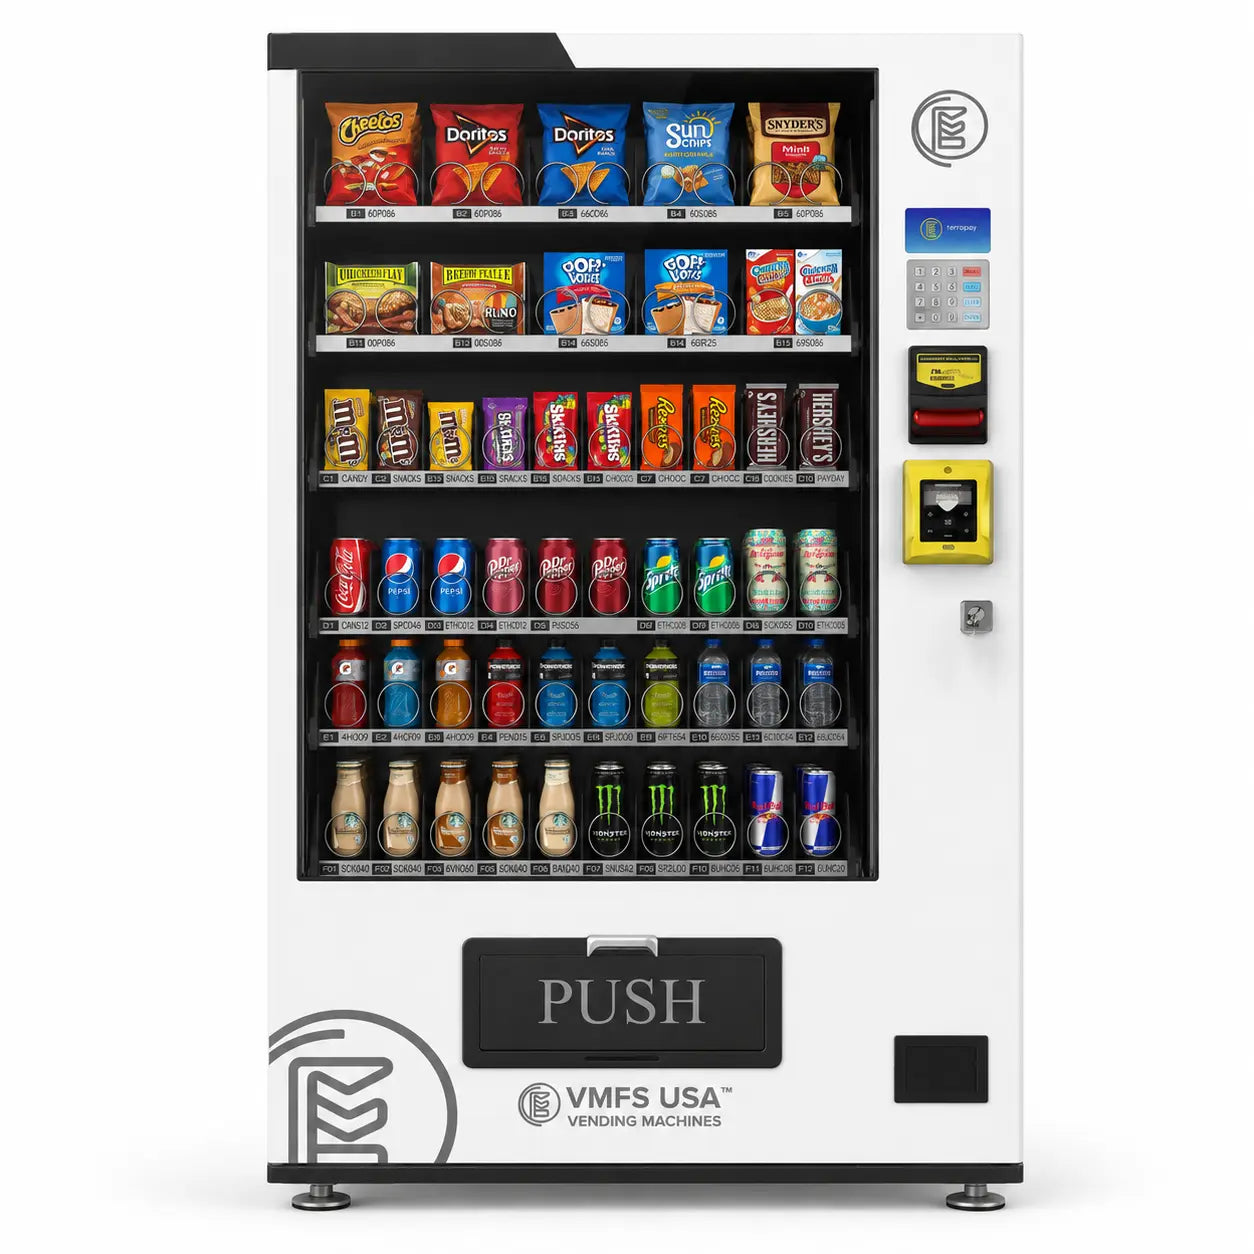
Operators building a margin strategy around beverages and packaged snacks should evaluate the AI Smart Cooler Vending Machine or the AI Smart Cooler Combo Vending Machine, both sized for high-turnover, low-perishability inventory.
Weighing Format Cost Against Margin Upside
A higher-margin product category only produces a better net result if the machine's price and payback period support it, so pairing category margin data against hardware cost is essential before committing capital. That comparison, including pre-made versus custom-built options, is detailed in pre-made vs. custom build payback analysis and the full AI vending machine ROI guide. For a complete side-by-side of every machine format available, see the complete AI vending machine buyer's guide, and for background on what separates AI recognition-based machines from coin-operated units, see what is an AI vending machine. Payment processing economics that affect net margin across every category are explained in how card processing works for AI vending machines, and whether upgrading from a traditional machine changes the margin picture is covered in is the AI upgrade worth it. Broader shifts in what smart retail buyers now expect are covered in the AI vending machine experiment on how smart retail is changing.
Frequently Asked Questions
What product category has the highest profit margin in AI vending machines?
Coffee typically delivers the highest gross margin, ranging from 60% to 75%, followed closely by bottled water and cold beverages, which can reach up to 86% margin due to near-zero ingredient cost.
Why does fresh food have a lower margin than snacks or coffee?
Fresh food carries higher ingredient, refrigeration, and shelf-life costs, which pushes gross margin down to 35% to 50%. Its much higher transaction value of $6 to $12 still makes it strongly profitable in absolute dollar terms.
What is a good overall profit margin for an AI vending machine?
A well-run AI vending machine typically achieves a 20% to 45% net profit margin after location commission, restocking, and operating costs, with gross margins across the full product mix commonly falling between 40% and 60%.
Should I focus on high-margin-percentage items or high-turnover items?
Neither alone is optimal. The strongest strategy blends fast-turning, high-margin staples like beverages and snacks with a smaller share of higher-ticket items like coffee or fresh food to maximize total profit per visit.
How much profit margin do healthy snacks generate?
Healthy snacks and protein bars typically post 35% to 50% gross margin, lower in percentage than candy, but they support premium pricing in wellness-aligned locations like gyms and corporate offices, which lifts absolute profit per unit.
Does bottled water really have an 86% profit margin?
Yes. A 16 oz. bottle of water costing around $0.14 and selling for $1.00 yields an 86% margin, making it one of the widest-margin products in any vending category due to its near-zero ingredient cost.
How do I know if a product is dragging down my machine's margin?
Track Gross Margin Return on Investment (GMROI) and sell-through rate by SKU. A product with low turnover for 2 to 3 weeks despite a high margin percentage should be replaced, since slow movers tie up inventory capital without generating returns.
What product mix works best for an office location?
Office buildings typically perform best with roughly 40% beverages, 35% healthy snacks, 15% coffee or tea, and 10% miscellaneous items, matched to a workforce that values convenience and moderate health-consciousness.
Do AI vending machines improve margins compared to traditional machines?
Yes. AI vending machines increase profit margins by 20% to 30% through reduced downtime, cashless payment adoption, dynamic pricing on near-expiration stock, and real-time inventory data that limits waste-driven margin loss.
How often should I review my product margins and mix?
Conduct a formal product mix review every 3 to 6 months, but monitor sell-through data continuously. Replace any item that hasn't sold within 2 to 3 weeks, adjusted for shelf life, with a better-performing alternative.
Share:
How to Start an AI Vending Machine Business - Step by Step Guide for Operators
Best Products to Sell in an AI Vending Machine - Detailed Guide For Operators