


Deciding which machine types and locations to replicate requires analyzing DEX telemetry sales volume, gross profit per stop, and labor dwell time to isolate your top-performing pairings. Rather than guessing, operators replicate high-yield pairings—such as multi-temperature combo machines in 24/7 logistics facilities—that hit a minimum net operating margin of 35% and payback equipment capital within 12 to 14 months.
Why Data-Driven Replication Drives Route Profitability
When scaling a route from a side business into an enterprise, deciding which machine types and locations to replicate based on performance data separates top-tier operators from those who bleed capital on underperforming placements. Early-stage operators frequently make the mistake of expanding based on convenience—buying whatever machine is listed cheap online or placing equipment in any venue that accepts a cold call.
This ad-hoc expansion dilutes profit margins and ballooning vehicle fuel costs. To scale profitably, operators must shift from intuitive guessing to quantitative analysis, using historical operational data to identify repeatable winning models.
To execute this strategy, operators evaluate four core operational metrics across their existing route:
-
DEX telemetry is a standardized data communications protocol used by vending machine controllers to remotely transmit sales, cashless transaction breakdown, and inventory logs to management software.
-
Net yield per stop is the net cash profit remaining from a service visit after subtracting wholesale cost of goods sold (COGS), location commission rates, credit card processing fees, and driver labor expenses.
-
Restock cadence is the optimal number of days between service visits required to keep machine columns filled above safety stock levels without triggering wasted trips.
-
Dwell time is the total minutes a service driver spends parked on-site at a location to restock, clean, and audit a machine.
Replicating an underperforming machine-location pairing compounds operational inefficiencies across your fleet. Conversely, systematically identifying and duplicating your top 20% revenue-generating setups ensures that every new dollar of capital deployed generates maximum risk-adjusted returns. By following proven frameworks to use real numbers to scale smarter, operators build dense, high-margin route clusters that outcompete legacy vendors.
Core Metrics for Evaluating Machine and Location Performance
Evaluating existing route performance requires isolating quantitative metrics that reveal true machine productivity rather than relying on top-line gross sales figures alone. A machine grossing $3,000 per month in a high-commission, high-rent venue can easily yield less net income than a machine grossing $1,800 per month in a low-friction industrial shop.

1. Net Yield Per Stop
Net yield per stop measures the exact dollar amount retained by the business every time a driver services a machine. High top-line revenue can mask high underlying operational costs, such as steep location commissions or high credit card processing rates.
$$\text{Net Yield Per Stop} = \text{Gross Sales per Visit} - (\text{COGS} + \text{Commission} + \text{Processing Fees} + \text{Labor Cost per Stop})$$
If a machine generates $250 per visit but incurs $110 in COGS, $37.50 in commission (15%), $12.50 in processing fees (5%), and $50 in driver labor/vehicle overhead, the net yield per stop is $40. If net yield drops below $35 per stop, the location-machine pairing should not be replicated. Integrating accurate inventory tracking software helps track these costs per stop in real time.
2. Inventory Turn Rate and Sales Velocity
Inventory turn rate measures how many times a machine's full product capacity is sold through and replenished over a 30-day period. High turn rates validate that the machine type matches the purchasing volume of the venue's foot traffic.
Inventory Turn Rate = Total Units Sold Per Month/Total Machine Holding Capacity (Units)
-
Target Benchmark: A healthy machine pairing achieves an inventory turn rate of 3.0x to 4.5x per month.
-
Low Turn Indication: A turn rate below 1.5x indicates that the machine is oversized for the location or the product selection lacks demand, increasing product shelf-life expiration risks.
3. Machine Uptime and Maintenance Drag
Machine uptime is the percentage of total operational hours that a vending machine is fully functional, accepting payments, and vending products without mechanical or telemetry faults.
Machine Uptime } = Total Operating Hours - Downtime Hours/Total Operating Hours x100
Replicating machine types that suffer from frequent coin mechanism jams, bill acceptor rejections, or refrigeration deck failures degrades route efficiency. If a specific machine model requires more than one service service ticket per month for mechanical failures, eliminate that hardware hardware profile from your future replication list.
The Machine-Location Pairing Matrix
Successful route replication depends on identifying the precise match between hardware configuration and venue demographic profiles. The matrix below outlines how different machine types perform across standard commercial location categories.
| Location Category | Recommended Machine Type | Average Monthly Gross | Target Net Margin % | Replicate Priority |
| 24/7 Logistics & Manufacturing (100+ Blue-Collar Staff) | Glass-Front Combo Vending Machines | $2,200 – $3,800 | 38% – 45% | Tier 1 (Highest) |
| Corporate Offices (75+ Professional Staff) | Smart Micro-Market / AI Grab-and-Go Machines | $1,500 – $2,600 | 32% – 40% | Tier 1 (Highest) |
| High-Dwell Waiting Rooms (Auto Repair, Dialysis, Urgent Care) | High-Capacity Snack Vending Machines + Drink Unit | $1,200 – $2,100 | 35% – 42% | Tier 2 (Moderate) |
| Fitness Centers & Gyms (500+ Active Members) | Specialized Health & Beverage Units | $900 – $1,700 | 40% – 50% | Tier 2 (Moderate) |
| Low-Traffic Breakrooms (<30 White-Collar Staff) | Standard Cash/Card Snack Unit | $300 – $600 | 15% – 25% | Do Not Replicate |
High-Yield Pairing Profile 1: Multi-Temp Combos in 24/7 Logistics Facilities
Industrial distribution centers and manufacturing plants with multi-shift operations represent the most reliable replication target in the vending industry.
-
Demographics: High percentage of blue-collar workers, short 30-minute meal breaks, limited off-site dining options, and 24-hour facility access.
-
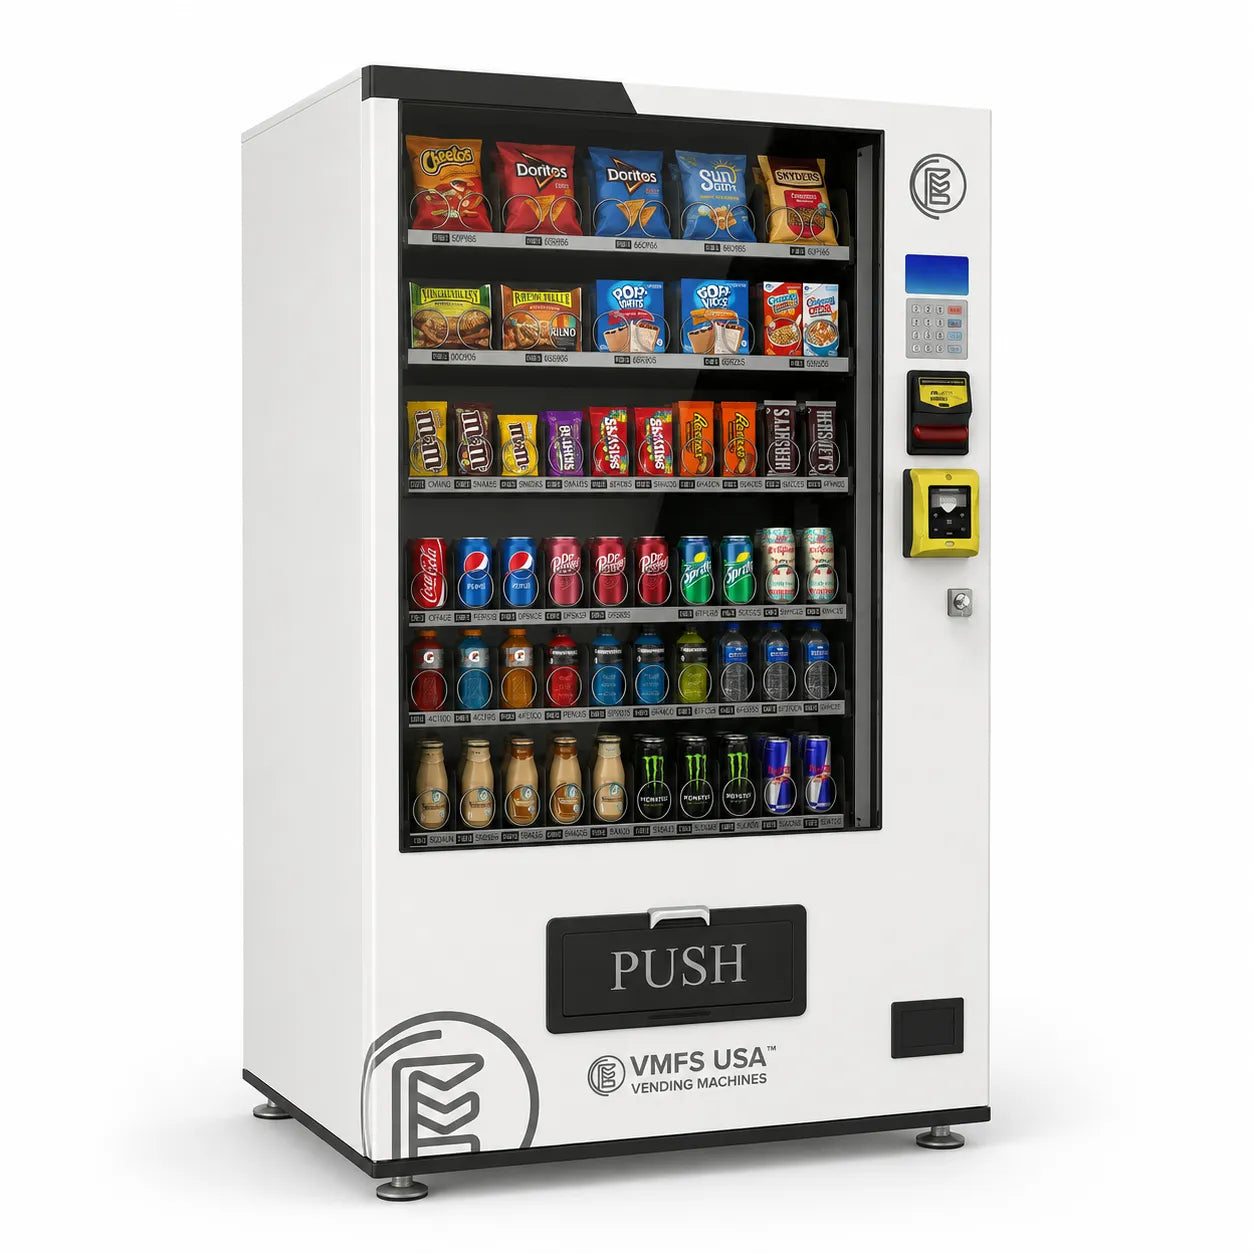
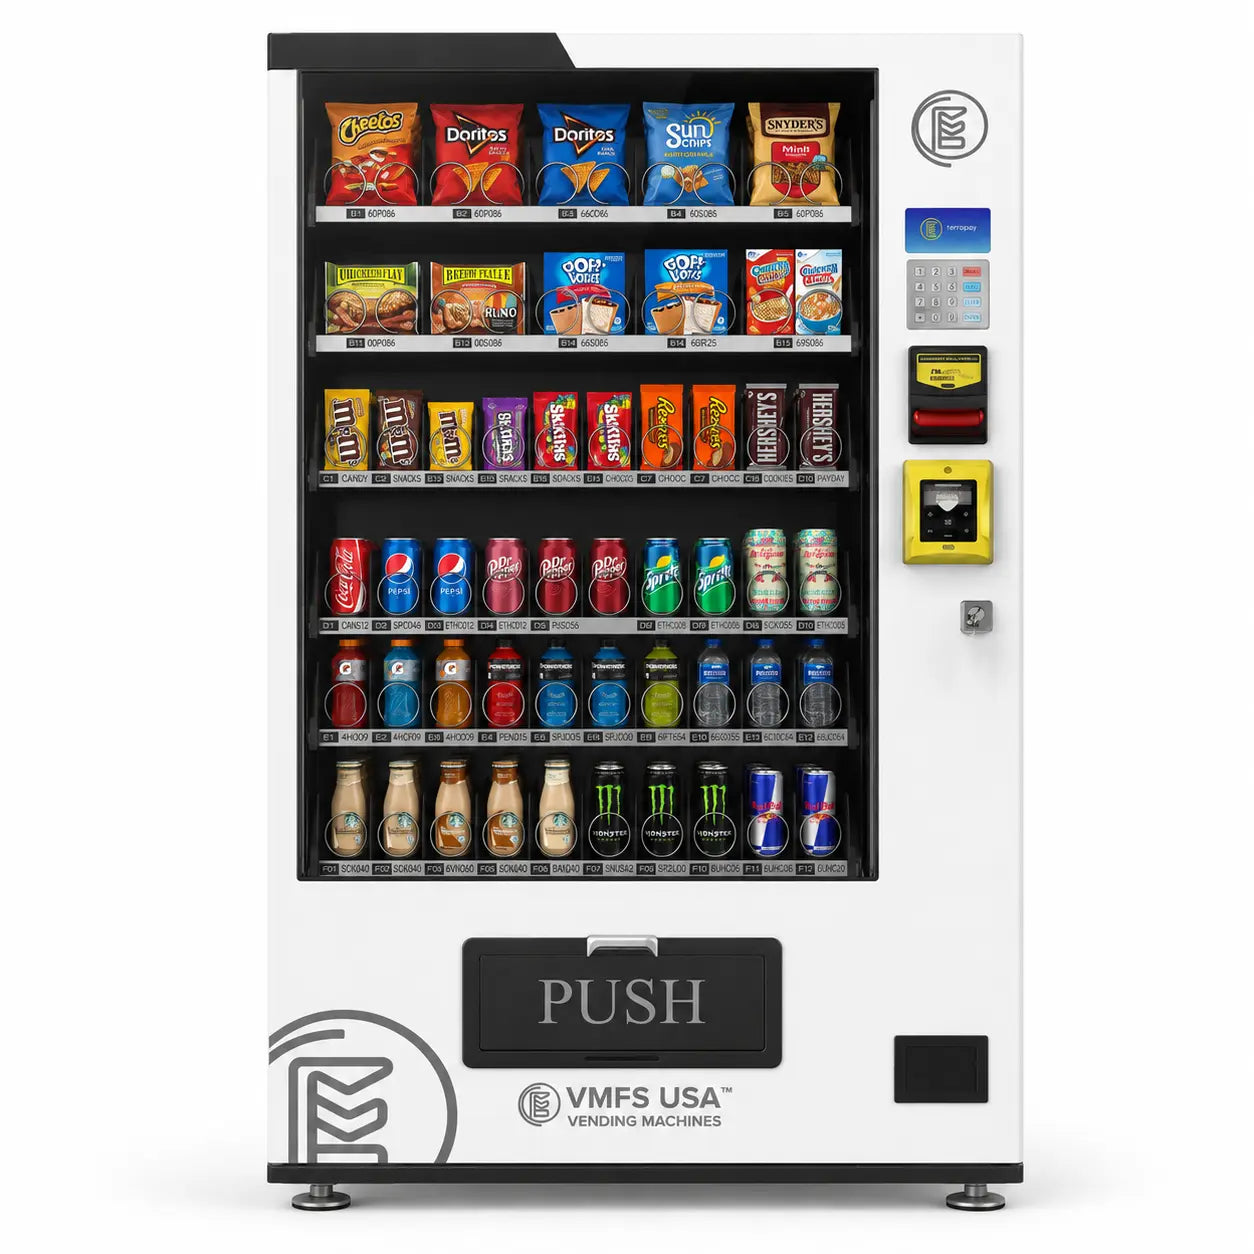
Hardware Requirement: Dual-zone temperature combo machines capable of vending cold beverages (sodas, energy drinks, water) alongside high-calorie snacks, fresh food, and microwavable items.
-
Economic Yield: High sales velocity allows for a 2-visit weekly restock cadence, maximizing route density and generating high dollar volume per stop.
High-Yield Pairing Profile 2: High-Capacity Beverage Units in High-Dwell Waiting Areas
Car dealerships, tire repair centers, hospital waiting lobbies, and service centers provide captive audiences with extended dwell times.
-
Demographics: Visitors experiencing high wait times (45+ minutes) seeking immediate refreshment.
-
Hardware Requirement: Dedicated high-capacity cold drink machines or canned/bottled beverage stack units with reliable bill validators and contactless payment readers.
-
Economic Yield: Cold beverages yield high total cash volume and fast transaction speeds, producing minimal mechanical wear and low service call frequencies.
High-Yield Pairing Profile 3: AI Smart Fridges in Corporate Offices & Gyms
Modern office environments and fitness facilities prefer high-end, aesthetic equipment that stocks fresh food, premium pre-workout drinks, and healthy snacks.
-
Demographics: Tech-literate, health-conscious consumers with high disposable income who prefer credit card or mobile app payments.
-
Hardware Requirement: AI grab-and-go vending machines equipped with weight sensors and computer vision cameras that support multi-item purchases per door opening.
-
Economic Yield: Higher average order value (AOV) per customer transaction offsets lower total foot traffic volume, yielding solid profit margins on premium-priced SKUs.
Step-by-Step Data Evaluation Framework for Scaling
Before allocating capital toward purchasing new equipment or securing new location contracts, follow this four-step evaluation process to analyze your current operational data.

Step 1: Audit 90-Day DEX Telemetry and Financial Logs
Export a minimum of 90 days of continuous DEX sales data from your Vending Management System (VMS) to eliminate seasonal noise (such as holiday office closures or summer heat spikes).
Compile a master spreadsheet detailing:
-
Total gross revenue per machine.
-
Net product COGS per machine.
-
Total transaction count (Cash vs. Cashless breakdown).
-
Total service visits and driver dwell time per stop.
Step 2: Calculate Location-Specific Break-Even and Return on Investment (ROI)
Calculate the exact payback period for every machine-location pairing in your fleet. The payback period defines how many months of net operating income are required to fully recover your initial capital expenditure (CapEx) for buying, delivering, and setting up the machine.
Practical Example:
An operator buys a refurbished combo machine for $3,800, spends $300 on freight and placement, $350 on a credit card reader, and loads $350 in initial inventory stock. Total setup capital equaled $4,800.
-
Monthly Gross Revenue: $1,800
-
Less COGS (42%): -$756
-
Less Location Commission (10%): -$180
-
Less Card Processing & VMS Fees (5.5%): -$99
-
Less Monthly Labor & Route Overhead Allocation: -$365
-
Monthly Net Operating Income: $400
If a machine-location pairing achieves a payback period of 12 to 14 months or less, it meets the benchmark for immediate capital replication. If the payback period exceeds 24 months, do not replicate the model.
Step 3: Audit Foot Traffic Demographics and Dwell Time
Analyze the underlying physical characteristics of your top-performing sites to build an ideal location profile for your sales efforts:
-
Foot Traffic Volume: Measure daily foot traffic passing within 50 feet of the machine.
-
Dwell Time Profile: Identify whether users are walking past (low dwell) or sitting in a breakroom/waiting area (high dwell).
-
Payment Demographics: Review your DEX telemetry cashless breakdown. Accounts where credit card and mobile wallet transactions exceed 70% indicate higher price tolerance and higher average order value.
Review detailed criteria on how to choose a profitable vending location to ensure prospective replication sites match these parameters.
Step 4: Validate Route Clustering and Spatial Density
Never replicate a high-performing location profile if the new prospective site is located far away from your existing route footprint. Adding a single high-performing machine 35 miles away from your route hub introduces stem time—the unbillable drive time between your warehouse and your first or last stop—which erodes profitability.
Only replicate into new locations that fall within a 10-mile driving radius of your existing service clusters. Maintaining route density keeps total drive time under 20% of your driver's daily shift, ensuring that labor costs remain low as your fleet grows.

Common Pitfalls When Replicating Vending Machine Placements
Avoid these critical analytical and operational errors when scaling your route based on historical data:
-
Replicating Machine Hardware Without Demographic Alignment: Installing an expensive smart fridge in a traditional industrial repair shop often leads to failure. Blue-collar shifts generally prefer classic, high-calorie snacks and energy drinks over premium cold-pressed juices or organic salad items.
-
Ignoring Location Commission Compression: Agreeing to higher commission rates just to secure a replica site compresses your net margin. For example, if your baseline model relies on a 10% commission rate and a prospective site demands 18%, a machine grossing $2,000 monthly loses $160 per month in net profit—extending your payback period by over 4 months. Maintain strict thresholds outlined in standard vending machine profit margin guidelines.
-
Failing to Account for Machine Depreciation: Used machines require higher ongoing maintenance spending as components age. When replicating with used equipment, factor higher repair reserves into your net yield calculations.
-
Scaling Beyond Inventory Capital Capacity: Replicating five new locations simultaneously requires upfront capital for machines and wholesale product stock. Ensure you have calculated how much it costs to stock a vending machine before deploying new units.
-
Misinterpreting Top-Line Gross Revenue: Assuming a machine grossing $3,000 per month is automatically profitable without auditing product cost differences can lead to poor decisions. High-volume fresh food or coffee machines carry higher spoilage rates and labor requirements than standard snack units.
Related Operational Decisions and Scaling Strategy
Once you isolate your winning machine-location pairings, align your asset selection with broader operational strategies across your business:
-
Hardware Selection & Sourcing: Decide whether to replicate using brand-new factory-warranted units or certified refurbished machines by consulting our guide on choosing the right types of vending machines.
-
Optimizing Product Margins on Replicated Units: Boost gross margin on new placements by refining your product selection using insights from our breakdown of the most profitable vending machine products.
-
Contract Negotiations for Replicated Sites: Secure new target accounts using standardized legal agreements by utilizing our customizable vending machine contract template.
-
Long-Term Enterprise Valuation: Structuring your route around standardized, data-verified machine-location pairings directly increases the market valuation of your business when executing a vending machine business exit strategy.
Key Takeaways
-
Isolate High Net Yield Units: Focus scaling capital exclusively on location-machine pairings that produce over $40 in net profit per service visit.
-
Analyze Foot Traffic Demographics: Replicate accounts matching your top-tier demographic footprints, such as blue-collar shifts with high dwell times or 24/7 site access.
-
Align Machine Hardware to Product Velocity: Match machine capacity and configuration directly to the specific product turnover speed of the venue.
-
Maintain Route Density: Only replicate into new accounts located within a 10-mile radius of existing route clusters to minimize unbillable windshield time.
Frequently Asked Questions
How many months of sales data do I need before replicating a vending location model?
You should analyze a minimum of 90 to 120 consecutive days of DEX telemetry sales data before determining whether a location-machine pairing is suitable for replication. This window accounts for short-term sales spikes, seasonal fluctuations, and holiday foot-traffic variations, ensuring your payback calculations are based on stable averages.
What is a good payback period when buying a new vending machine for replication?
A target payback period for new or refurbished vending equipment is between 12 and 14 months. If your net operating income recovers the total capital invested (machine purchase price, freight, cashless card readers, and initial inventory setup) within this timeframe, the placement model is suitable for aggressive scaling.
Should I replicate snack machines or combo machines when scaling a new route?
Replicate combo vending machines when entering high-volume locations with over 75 daily foot-traffic users, as they maximize revenue per square foot by offering snacks and cold drinks from a single footprint. Replicate dedicated snack machines primarily when pairing them alongside existing high-capacity soda stack machines in high-density locations.
How do I know if a prospective location matches my top-performing site?
Verify that the prospective site matches your top performer's shift structure (e.g., 24/7 access vs. standard 9-to-5), daily foot-traffic volume within 50 feet of the machine, visitor dwell time (e.g., breakrooms or waiting areas), and blue-collar to white-collar employee ratios. Matching these four variables ensures high revenue predictability.
How long should I give a bad vending location before pulling the machine?
Give a low-performing location 60 to 90 days after optimizing product mix and pricing before deciding to relocate the equipment. If net sales fail to cover minimum stop costs and product margin requirements after adjustment attempts, pull the machine and relocate it to a location matching your verified replication matrix.
Share:
Reinvesting Profit vs. Taking Income Out - Operator’s Cash Allocation Guide
Relocate vs. Pull the Machine: A Decision Guide for Unprofitable Vending Locations