



Design the perfect vending solution for your location and customers.

Sales, inventory and alerts for your whole route, from one machine to a fleet.
Answer a few questions about your location, products and budget and get a shortlist.
Estimate revenue, payback period and margin before you buy.
Sales, setup help, warranty and parts from the VMFS USA team.
Join the VMFS newsletter and step into a thriving network dedicated to collective success.
One signup. Endless possibilities.
Coffee vending business ROI depends on three core variables — equipment cost, per-cup margin, and daily transaction volume — and calculating it accurately requires realistic volume assumptions rather than best-case projections that rarely hold up at a new location. This guide walks through the break-even formula operators actually use, realistic payback timelines by location type, the specific factors that separate a profitable machine from one that never recovers its investment, and how location choice and contract terms shape the numbers before a machine is even installed.
Quick answer: Most coffee vending machines break even between 4 and 24 months, depending almost entirely on daily transaction volume. High-traffic public locations (hospitals, transit hubs, manufacturing plants) typically recover a $3,000–$12,000 equipment investment in 4–8 months, while low-traffic office placements can take 14–24 months or longer. The formula is simple — equipment cost divided by daily cups sold times per-cup margin — but the accuracy of the result depends entirely on how conservative and evidence-based the volume assumption is.
Coffee vending business ROI is driven by the relationship between fixed equipment cost and the recurring profit generated per cup sold, meaning ROI improves whenever margin per cup rises or transaction volume increases faster than operating costs. A machine at a high-traffic location with strong per-cup margin reaches profitability far sooner than an identical machine at a low-traffic site.
This calculation sits downstream of the broader market conditions covered in the coffee vending machine market 2025 report, since location demand and competitive density both shape the realistic volume assumptions any ROI projection should use. Industry-wide vending performance data compiled by IBISWorld consistently identifies foot traffic and dwell time as the two strongest predictors of vending revenue across nearly every category of machine, not just coffee — which is exactly why the location variable deserves as much attention as the equipment itself.
The fixed investment that per-cup profit must recover before returns begin.
Revenue per cup minus ingredient, cup, and operating cost per transaction.
Transaction count directly multiplies per-cup margin into total daily profit.
Maintenance, supplies, and any rental or lease payments reduce net returns.
The break-even formula for a coffee vending machine divides total equipment and setup cost by daily profit — daily cups sold multiplied by per-cup margin — to calculate the number of days until the investment is recovered. A machine costing $5,000 with a $0.60 per-cup margin selling 40 cups daily generates $24 in daily profit, reaching break-even in roughly 208 days.
Formula: Break-even days = Total equipment cost ÷ (Daily cups sold × Per-cup margin). Adjust the equipment cost input using current figures from the coffee vending machine collection page rather than outdated estimates, since pricing shifts over time.
It's worth noting this formula only accounts for the initial capital outlay. It does not capture the time value of money, opportunity cost of capital tied up in equipment, or the risk that a location underperforms and never reaches its assumed daily volume at all. Operators building multi-location ROI models often layer in a discount rate or risk adjustment on top of the raw break-even number, particularly when comparing a guaranteed-return alternative like a bank CD against a vending investment with real, if modest, uncertainty.
Realistic payback timelines vary significantly by location type because daily transaction volume is the single largest variable in the break-even formula, and volume differs dramatically between a busy transit hub and a small office break room. Office placements, covered in the context of best office coffee machines, typically prioritize employee satisfaction over direct ROI, while public high-traffic locations are evaluated more strictly on payback speed.
Because daily transaction volume carries more weight in the break-even formula than almost any other input, the single highest-leverage decision an operator makes is where the machine actually goes — not which model to buy. Two identical machines with identical pricing can post break-even timelines months apart purely because one sits somewhere with genuine foot traffic and dwell time, and the other doesn't.
This guide to best locations to place a coffee vending machine breaks down exactly which venue types combine the traffic and dwell-time characteristics that translate into strong daily volume — hospitals, manufacturing plants, and university campuses tend to outperform low-dwell-time spots like transit platforms or quick-turnover retail counters, even when raw visitor counts look similar on paper. Before running an ROI projection for any prospective site, it's worth cross-checking the location type against that framework rather than relying on traffic numbers alone.
A related point often overlooked in ROI modeling: competition density at the location matters as much as the traffic itself. A machine placed within view of a full-service café will typically see suppressed volume regardless of how busy the location otherwise is, which is why the placement guide above weights competition risk alongside traffic and dwell time when ranking location types.
Several controllable factors improve ROI beyond location selection alone, since operators have direct influence over machine choice, pricing strategy, and operating efficiency even when foot traffic is fixed. Improving any one of these variables shortens the break-even period without requiring higher transaction volume.
Choosing a machine with lower ongoing maintenance needs and efficient supply consumption reduces the recurring costs that eat into per-cup margin, directly improving net ROI over the equipment's service life. A compact unit like the premium countertop touch screen coffee machine suits lower-volume sites where a larger commercial footprint would sit underutilized, while higher-volume locations justify stepping up to something like the coffee and hot beverage vending machine, which supports higher daily throughput and a broader menu.
Setting per-cup pricing appropriately for the location's customer base and competitive context directly raises per-cup margin — the single most powerful lever in the break-even formula, since it multiplies against every transaction rather than affecting a one-time cost.
Operators running multiple machines on a coffee vending route improve fleet-wide ROI by minimizing service travel time and consolidating supply restocking, lowering the operating cost allocated to each individual machine.
This table illustrates how machine category affects the break-even calculation, assuming moderate daily volume and standard commercial per-cup pricing.
| Machine Type | Approx. Equipment Cost | Typical Daily Cups | Approx. Break-Even Timeline |
|---|---|---|---|
| Countertop touchscreen unit | $2,000–$3,500 | 15–30 | 10–16 months |
| CorePro coffee vending machine | $3,500–$5,500 | 30–60 | 7–13 months |
| Coffee and hot beverage machine | $6,000–$9,000 | 60–100 | 6–11 months |
| Pro coffee vending machine | $7,500–$12,000 | 100+ | 5–9 months |
| Iced coffee vending machine | $7,000–$11,000 | 80–120 | 6–10 months |
You can compare specifications, pricing, and configuration options for every model above directly on the full coffee vending machine collection page before finalizing your equipment budget.
Per-cup margin is calculated by subtracting ingredient cost, cup and lid cost, and an allocated share of maintenance expense from the per-cup selling price. A cup priced at $2.00 with roughly $0.40 in combined ingredient and consumable cost, plus a small maintenance allocation, typically nets $1.30 to $1.50 in usable margin per transaction.
Operators should calculate this margin conservatively, since underestimating consumable or maintenance cost is one of the most common reasons projected ROI overstates actual returns once a machine is in live operation. According to general small business equipment guidance from the U.S. Small Business Administration, building a maintenance and depreciation buffer into any equipment ROI model — rather than assuming zero unplanned cost — produces far more reliable long-term financial planning than a bare-bones break-even number alone.
Choosing between operating a single machine and building a multi-machine route affects both total ROI potential and the operational complexity required to achieve it. A single well-placed machine offers simpler management but caps total revenue potential compared to a distributed route.
Even a perfectly chosen location with strong projected volume can quietly underperform its ROI model if the placement agreement isn't structured properly. Commission percentages, exclusivity terms, and termination notice periods all directly affect the numbers in the break-even formula — a high commission rate eats straight into per-cup margin, while a short or missing termination notice period exposes the operator to losing a high-performing location before the investment is even recovered.
This breakdown of coffee vending machine placement contracts and legalities covers the specific clauses worth reviewing before signing — commission structure, exclusivity protection, equipment ownership, and liability terms — all of which should be modeled into the ROI projection rather than treated as an afterthought once the machine is already installed. A contract that looks reasonable on paper can still quietly shift 5–10% of gross revenue away from the operator, which is often enough to add several months to an otherwise solid break-even timeline.
The most common ROI calculation mistake is using best-case daily volume assumptions instead of conservative, evidence-based estimates, since new locations rarely hit peak transaction volume immediately after installation. Ramp-up periods of several weeks to a few months are typical before a location's daily volume stabilizes.
A second common mistake is omitting recurring costs — maintenance, supplies, and any financing payments — from the margin calculation, which inflates projected ROI and leads to disappointing actual returns once real operating expenses are accounted for.
A third, less obvious mistake is failing to account for commission or revenue-share terms in the placement contract before modeling ROI — a projection built on gross per-cup margin without subtracting the property's cut will overstate real returns from day one.
Tracking actual daily transaction counts against the original ROI projection lets operators catch underperforming locations early and make informed decisions about relocating, adjusting pricing, or exiting a placement before sunk costs grow further. This discipline matters most in the first 60–90 days after installation, when actual volume patterns become clear.
Comparing performance across multiple machines also helps identify which location types and machine categories consistently outperform projections, informing smarter placement decisions for future equipment purchases — a feedback loop that, over time, tends to validate the same location-quality factors highlighted in independent vending industry research from sources like the National Automatic Merchandising Association (NAMA), which tracks broader vending performance trends across the industry.
Browse VMFS USA's commercial coffee vending machine lineup and compare equipment cost against your projected volume.
Shop Coffee Vending Machines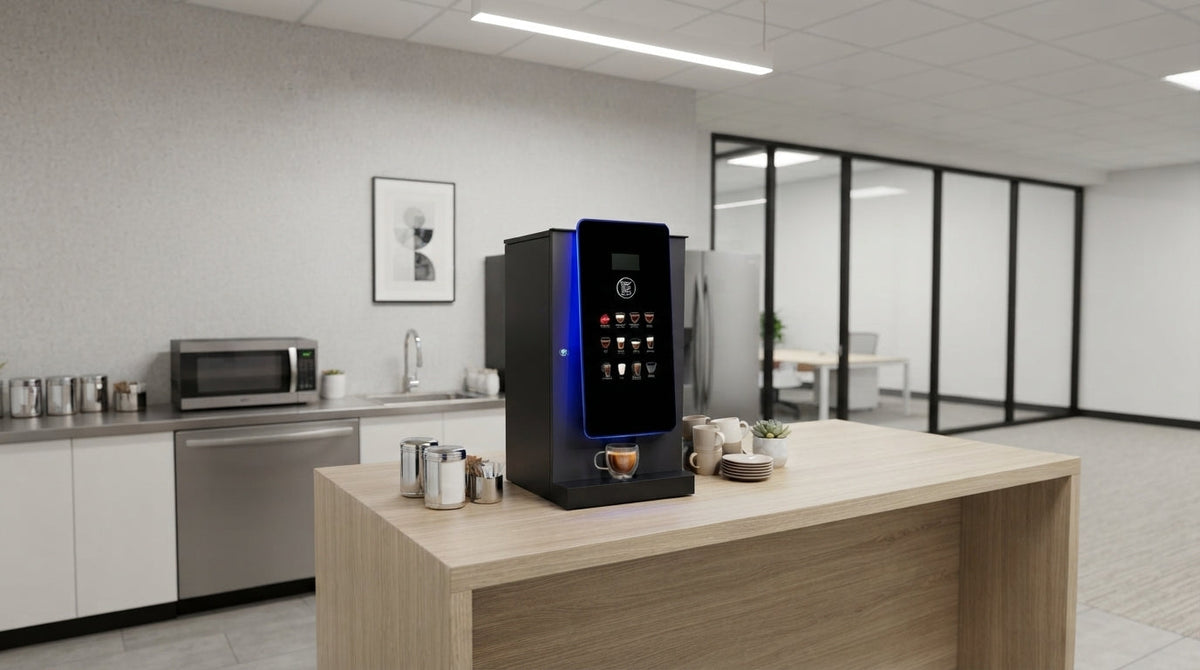

Share:
AI Vending Machine Repair Services - What to Know Before Something Breaks
What Are Pokémon Vending Machines? The Real Story Behind 2026's Hottest Retail Trend