


A coffee vending route is a network of coffee vending machines placed across multiple host locations, serviced on a recurring schedule, and managed as a single operating business rather than as standalone machines. Profitability depends on three controllable variables: location traffic, restocking discipline, and machine uptime — not luck.
Table of Contents
- What Is a Coffee Vending Route?
- Coffee Vending Route Economics: Margins, Revenue & Costs
- Choosing the Right Coffee Vending Machines for a Route
- Building a Coffee Vending Route From Zero
- Location Strategy: Where Coffee Routes Perform Best
- Restocking, Servicing & Daily Operations
- Location Commissions & Contract Terms
- Scaling a Route: From One Machine to a Fleet
- Pros & Cons of Running a Coffee Vending Route
- Coffee Routes vs. Snack & Combo Routes
- Common Operational Mistakes That Kill Margin
- Frequently Asked Questions
What Is a Coffee Vending Route?
A coffee vending route is the set of physical stops — offices, hospitals, gyms, dealerships, breakrooms — an operator visits on a fixed cycle to restock product, collect cash, reconcile cashless sales data, and perform light maintenance on each installed coffee vending machine. The route is the operational backbone of a coffee vending business: machines generate the revenue, but the route determines whether that revenue gets collected efficiently or eaten alive by drive time and spoilage.
Routes differ from single-machine placements because the unit of management is the schedule, not the machine. An operator with eight machines spread across a 20-mile radius runs one route with one truck, one restocking calendar, and one P&L. An operator with eight machines spread across three states runs three routes, because drive time becomes the binding constraint on profitability long before machine count does.
Key relationship: Route density drives route profitability. Two machines ten minutes apart generate more net profit per service hour than two machines two hours apart, even at identical per-cup revenue, because labor and fuel cost scale with distance, not with machine count.
Coffee Vending Route Economics: Margins, Revenue & Costs
Coffee vending delivers the highest gross margin of any common vending category because coffee vending machine economics run on a per-cup cost of roughly $0.30–$0.80 (beans, water, cups, lids, syrup) against a retail price of $1.50–$4.50, producing gross margins of 60–80% in most placements. That spread is structurally wider than snack vending (typically 25–45% net) because coffee has no perishable shelf-life pressure, no SKU sprawl, and almost no shrinkage from theft.
60–80%Gross margin per cup
$0.30–$0.80Cost per cup (COGS)
$1.50–$4.50Typical retail price per cup
12–18 moTypical hardware payback
Net profit per machine depends on daily cup volume, which is itself a function of foot traffic and dwell time at the host location. A machine selling 40 cups a day at a $2.50 average ticket generates roughly $3,000 in monthly revenue; after COGS, location commission, and card-processing fees, realistic net profit lands between $1,200 and $1,800 per machine per month in a well-placed office or hospital location.
| Daily Cup Volume | Monthly Revenue (avg $2.50/cup) | Est. Monthly COGS (30%) | Est. Net Profit (after commission) |
|---|---|---|---|
| 15 cups/day | $1,125 | $338 | $350–$500 |
| 30 cups/day | $2,250 | $675 | $900–$1,200 |
| 50 cups/day | $3,750 | $1,125 | $1,800–$2,300 |
| 80+ cups/day | $6,000+ | $1,800 | $3,000–$3,800 |
These figures assume a 15–25% location commission and standard cashless processing fees of roughly 6–8% per transaction. High-traffic venues — airports, hospitals, large distribution centers — routinely clear 80+ cups a day per machine, while a 30-person office breakroom more commonly sits in the 15–30 cup range. Volume, not machine sophistication, is the primary lever on route-level profit.
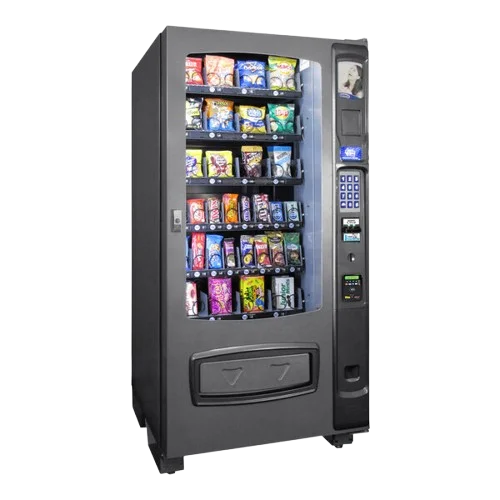
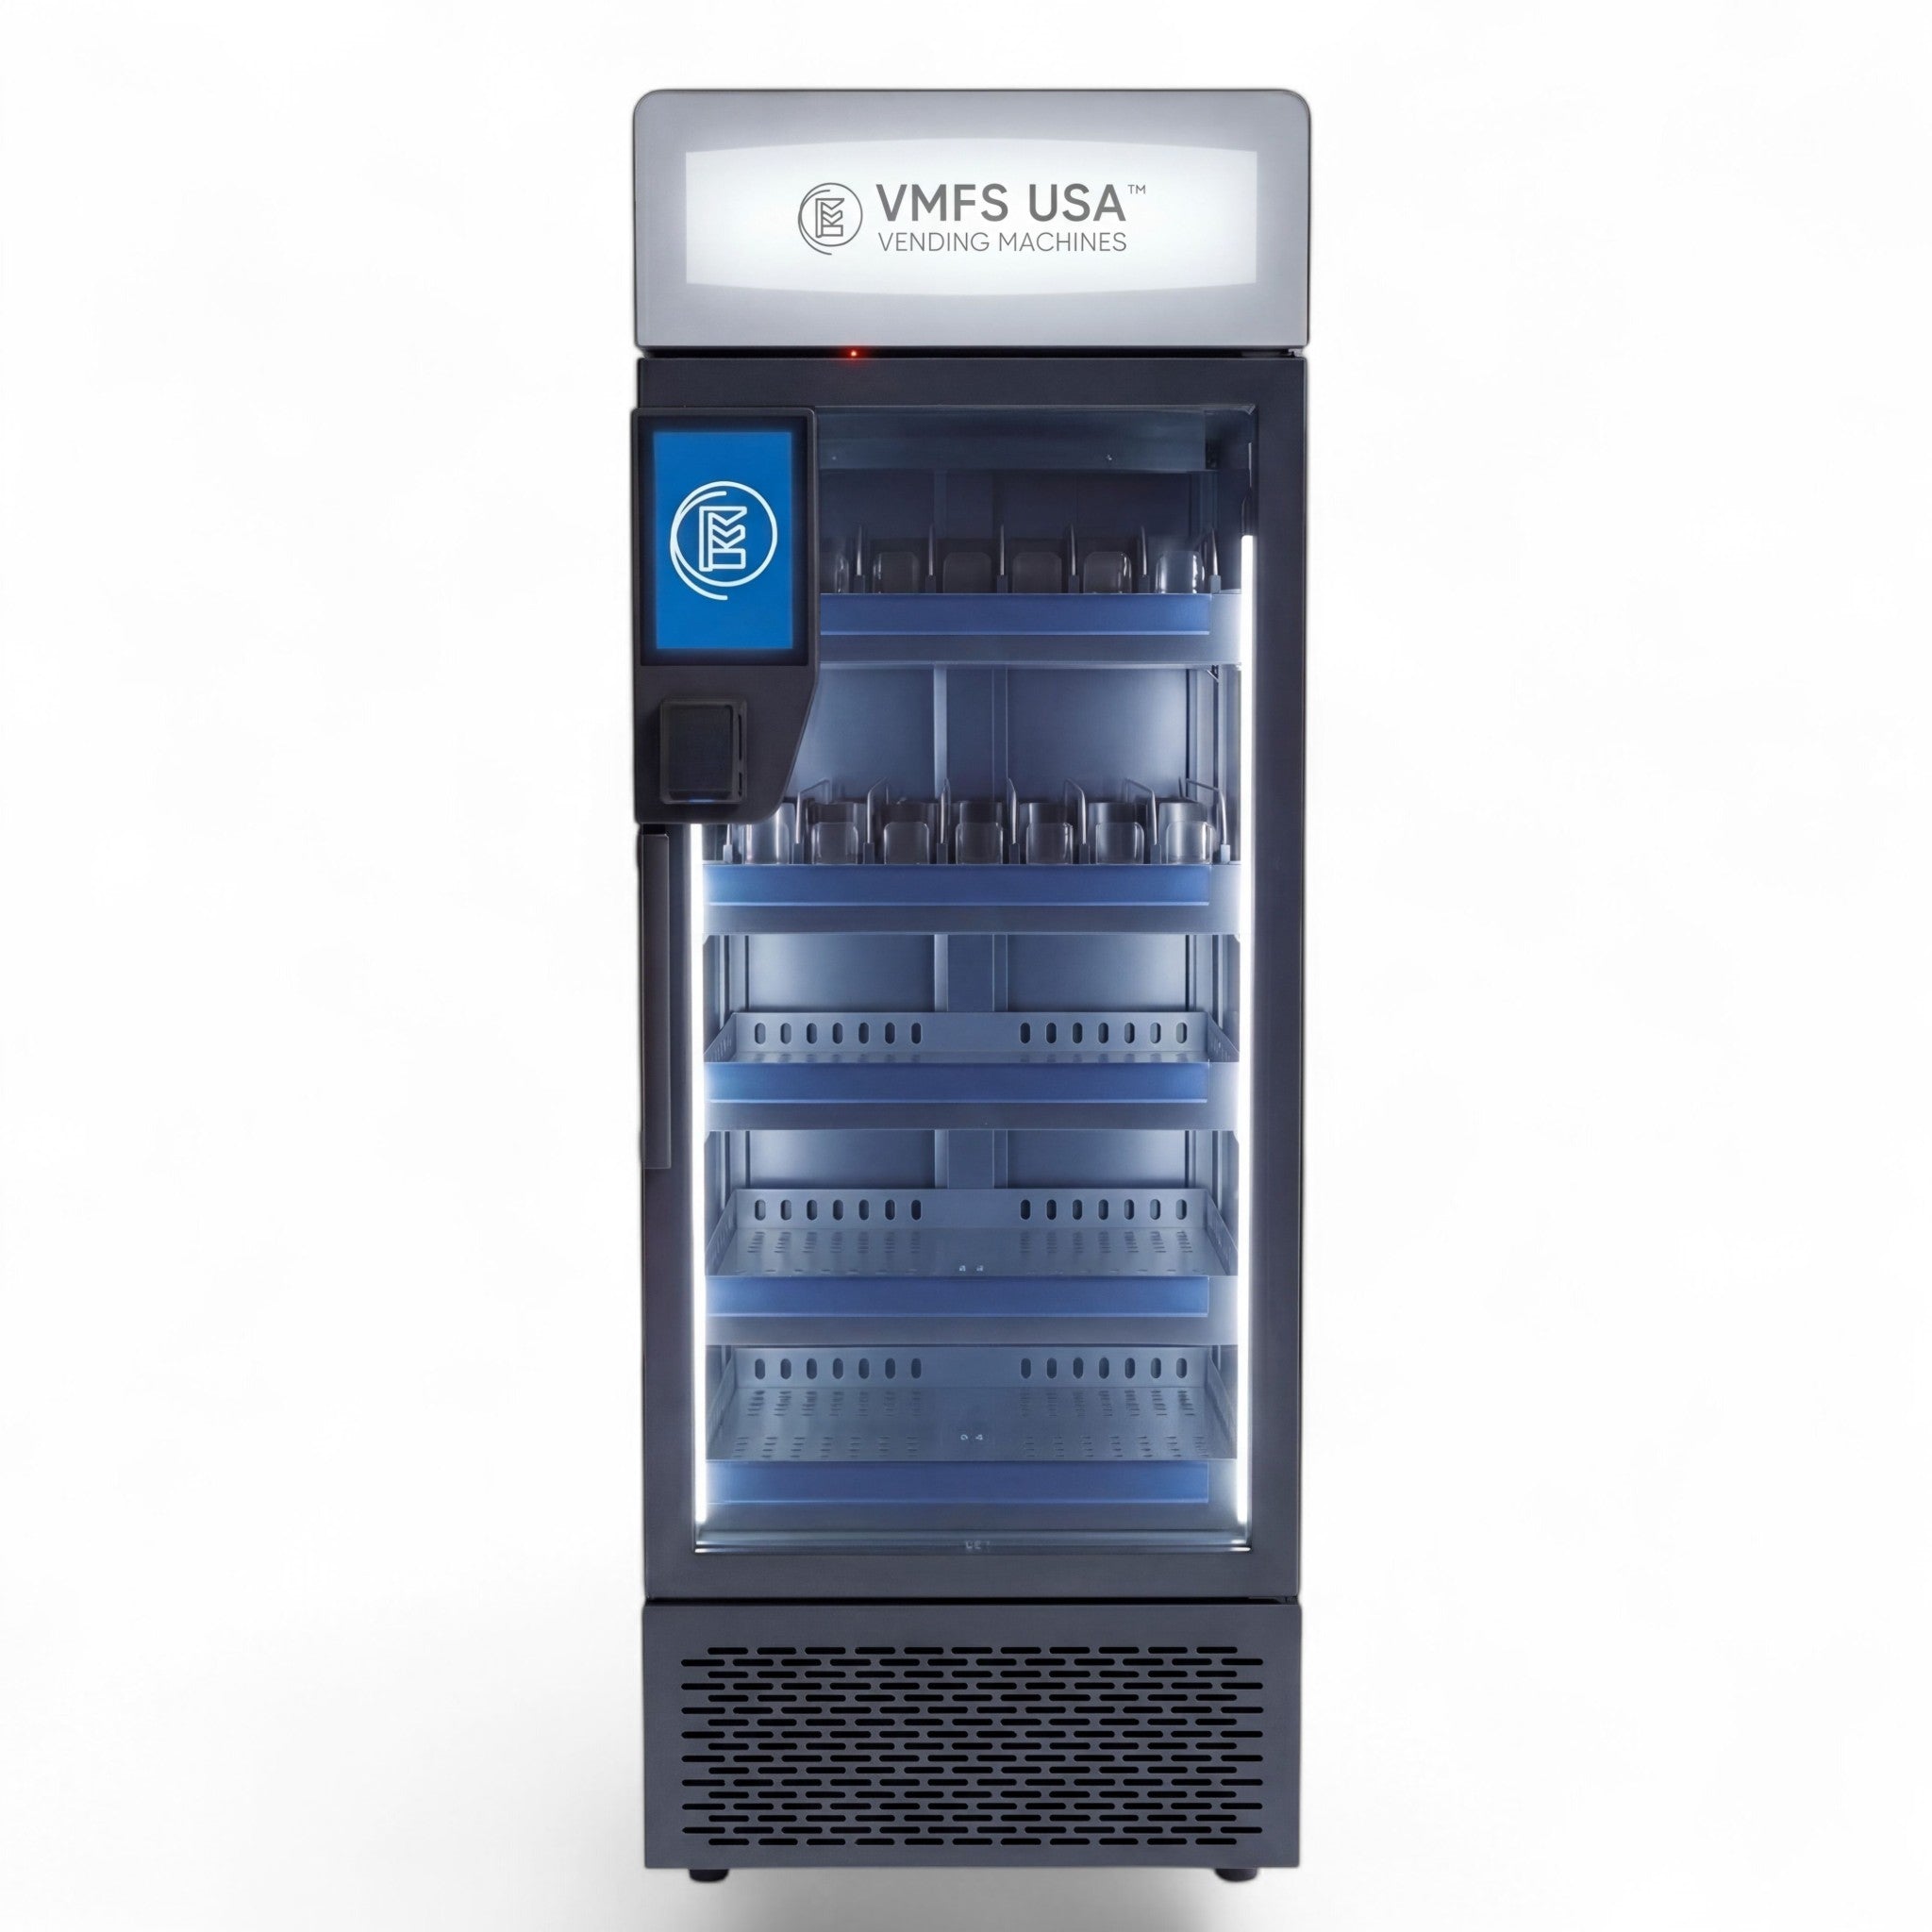
Choosing the Right Coffee Vending Machines for a Route
Machine selection for a coffee route should match three variables to the location: expected daily volume, available footprint, and whether the host wants bean-to-cup quality or simple instant/filter service. Choosing the wrong tier of machine for the location is the single most common reason new routes underperform their projections.
1
Instant/Powder Machines
Lowest cost per unit ($1,500–$3,000) and simplest maintenance. Best for low-volume breakrooms under 25 cups/day where speed matters more than quality.
2
Bean-to-Cup Machines
Grinds whole beans per cup for cafe-quality output. Higher upfront cost ($4,000–$8,000) but supports premium pricing of $3–$4.50 per cup in offices and hotels.
3
Smart/Cashless-Enabled Units
Built-in card readers and remote telemetry. Increases transaction value and gives operators real-time sales data to plan restocking routes more efficiently.
4
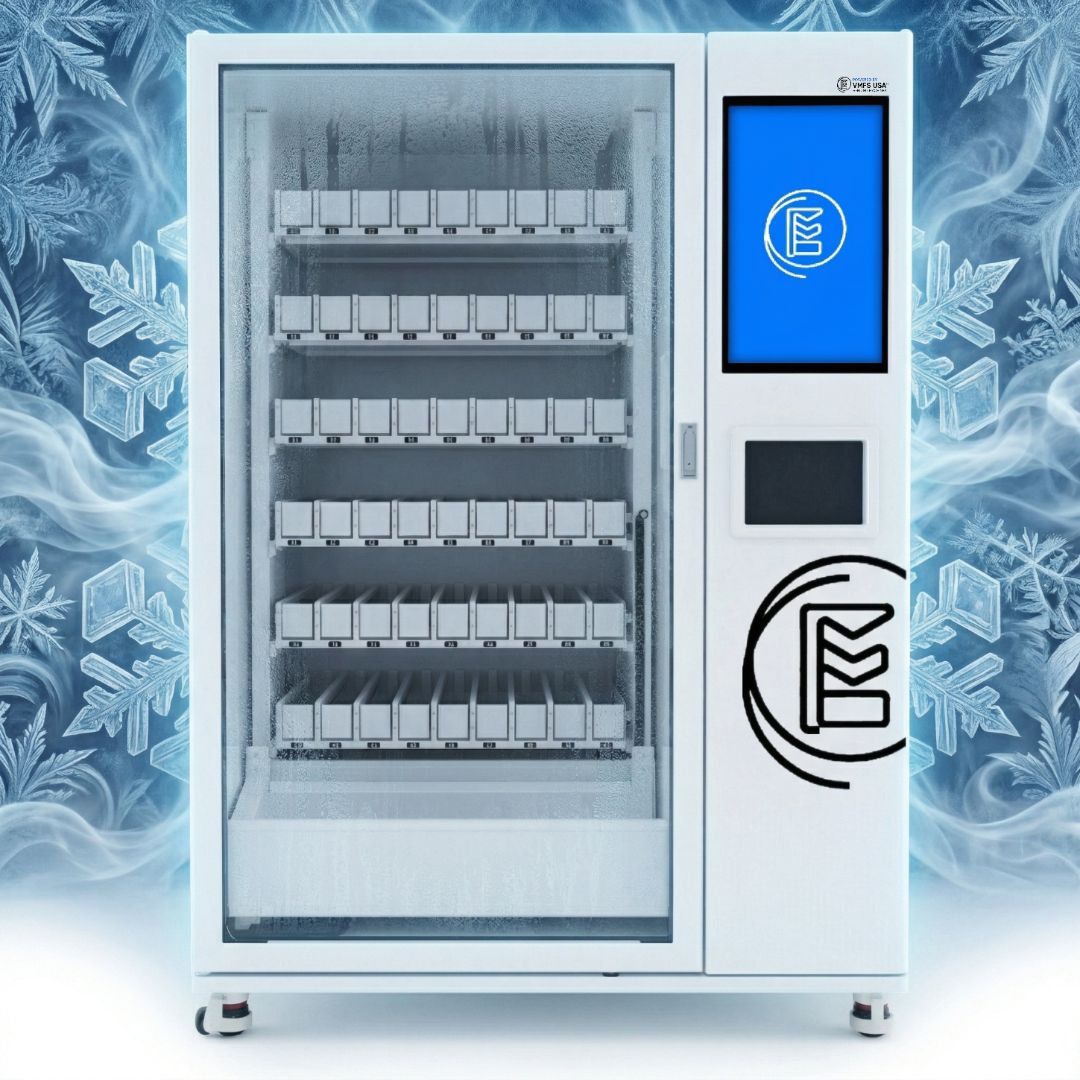
AI/Robotic Coffee Kiosks
Highest upfront investment but unlocks 24/7 unmanned operation in airports, malls, and hospitals, with gross margins frequently reported at 70–85% in prime locations.
Capacity planning matters as much as machine type. A machine sized for 200 cups between visits forces twice-weekly restocking on a low-volume route, wasting service hours. Matching hopper and water-tank capacity to the realistic visit cadence for that stop is what keeps a route's service-hours-per-dollar-of-revenue ratio healthy.
Building a Coffee Vending Route From Zero
Building a coffee vending route starts with location acquisition, not machine purchase, because an operator with five confirmed locations and zero machines is closer to profitability than an operator with five machines and no signed placement agreements. The sequence below reflects how experienced operators actually build routes.
| Step | Action | Why It Matters |
|---|---|---|
| 1 | Identify and pitch host locations | Locations determine volume; volume determines everything downstream |
| 2 | Negotiate commission & placement terms | Sets your true margin before any machine is purchased |
| 3 | Select machine tier per location | Right-sized hardware avoids overspending on low-traffic stops |
| 4 | Install & set up cashless payment processing | Cashless raises average ticket and removes cash-collection risk |
| 5 | Set a restocking cadence per stop | Prevents stockouts (lost sales) and over-servicing (wasted labor) |
| 6 | Track sales data weekly | Identifies underperforming stops to renegotiate or remove early |
New operators commonly secure three to five locations before purchasing the first machine, using that signed pipeline to negotiate better equipment financing and to sequence installs so the route stays geographically tight from day one.
Location Strategy: Where Coffee Routes Perform Best
Coffee vending performs best in locations with predictable daily dwell time and a captive population that cannot easily leave for coffee — offices, hospitals, manufacturing facilities, distribution centers, and large apartment communities. Coffee is a daily habit purchase, which makes repeat-traffic venues structurally stronger for coffee routes than impulse-traffic venues like retail storefronts.
A
Offices & Corporate Parks
Steady morning and early-afternoon peaks. Best fit for bean-to-cup machines at $2–$3 per cup.
B
Hospitals & Medical Centers
24-hour staffing creates round-the-clock demand. Strong candidates for AI/robotic units with extended capacity.
C
Warehouses & Distribution Centers
Shift workers with limited break time favor fast-dispense machines over cafe-style service.
D
Hotels & Transit Hubs
Transient, higher-spend customers support premium pricing of $3–$4.50 per specialty cup.
Foot traffic alone is an unreliable predictor of coffee sales. A retail location with 2,000 daily visitors but five-minute average dwell time will underperform a 150-employee office with eight-hour dwell time, because coffee vending depends on repeat purchases from the same population, not one-time impulse buys from a transient crowd.
Restocking, Servicing & Daily Operations
Restocking cadence should be set by sell-through rate, not by calendar convenience, because a stockout during peak demand hours represents permanently lost revenue — the customer does not wait or return later. Operators running smart machines with remote telemetry can trigger restock visits based on actual inventory data rather than guessing on a fixed schedule.
Operational rule: A machine running below 20% hopper capacity at peak demand hours is a stockout risk. Telemetry-enabled machines flag this automatically; manual-check routes should build a buffer of at least 2 service days before the projected depletion date.
Beyond restocking, weekly servicing should include water-line sanitation, cup and lid inventory checks, payment terminal connectivity tests, and a visual inspection for vandalism or mechanical wear. Coffee machines with internal water reservoirs require more frequent sanitation than those connected to a direct water line, which factors into total service time per stop when scheduling a route.
Location Commissions & Contract Terms
Most host locations expect a commission of 5–25% of gross sales in exchange for placement, with the rate scaling based on expected traffic volume and whether the operator or the host covers electricity. High-traffic locations with leverage (large hospital systems, major employers) can command the top of that range; smaller offices and lower-traffic sites typically settle closer to 10%.
| Contract Element | Typical Term | Negotiation Lever |
|---|---|---|
| Commission rate | 5–25% of gross sales | Lower for guaranteed minimum volume commitments |
| Contract length | 12–36 months | Shorter terms in exchange for higher commission |
| Electricity cost | Host-covered (standard) | Operator-covered if commission rate is reduced |
| Exclusivity clause | Operator is sole coffee vendor on-site | Standard request; protects volume projections |
| Termination notice | 30–60 days | Protects operator from sudden machine removal cost |
Written agreements should specify who is responsible for machine damage, what happens if a host relocates or closes, and a minimum notice period before contract termination. Verbal placement agreements are common among new operators but expose the route to sudden, uncompensated machine removal.
Scaling a Route: From One Machine to a Fleet
Scaling a coffee vending route happens through geographic densification first, then through machine-count expansion, because adding a machine ten minutes from an existing stop costs almost nothing in incremental labor while adding one two hours away creates a second de facto route. Operators commonly reach $100,000+ in annual profit once a route reaches 15–25 well-placed machines, assuming an average net profit of roughly $400–$600 per machine per month.
5–8Machines per solo operator route
15–25Machines to justify first hire
25+Machines: multi-route, multi-driver stage
The transition point for hiring a second route driver typically arrives when total weekly service time exceeds what one person can cover without sacrificing restock frequency — usually somewhere between 15 and 25 machines, depending on route density. Past that point, route software for stop sequencing and inventory tracking becomes necessary rather than optional, because manual scheduling error compounds quickly across multiple drivers.
Pros & Cons of Running a Coffee Vending Route
Pros
- Highest gross margin category in vending (60–80%)
- Daily-habit product creates predictable repeat demand
- No perishable shelf-life risk compared to fresh food vending
- Scales cleanly: route economics improve with density
- Smart machines provide real-time sales data for optimization
Cons
- Higher upfront hardware cost than basic snack machines
- Requires more frequent water-line and hygiene maintenance
- Volume is highly location-dependent; weak placements underperform fast
- Mechanical complexity (grinders, brewers) increases service calls
- Route density matters more here than in low-frequency categories
Coffee Routes vs. Snack & Combo Routes
Coffee routes and snack/combo routes solve different problems and are often run side by side rather than as substitutes. Coffee delivers superior margin per transaction; snack and combo machines deliver broader product appeal and lower mechanical complexity, which is why many operators place both machine types at the same host location to capture a wider range of purchase occasions.
| Factor | Coffee Vending Route | Snack/Combo Vending Route |
|---|---|---|
| Gross margin | 60–80% | 25–45% |
| Avg. hardware cost | $1,500–$10,000+ | $2,000–$5,000 |
| Restocking frequency | Higher (consumable beans, cups, milk) | Lower (shelf-stable snacks) |
| Mechanical complexity | Higher (grinders, brewers, water lines) | Lower (spiral coils, refrigeration only) |
| Best-fit locations | Offices, hospitals, hotels | Gyms, schools, apartments, breakrooms |
Common Operational Mistakes That Kill Margin
Most underperforming coffee routes fail for operational reasons, not market reasons, because the category's margin ceiling is high enough to absorb mediocre management for a while before the losses become visible. The most common errors compound silently across months before an operator notices the route is unprofitable.
Oversized machines on low-traffic stops tie up capital that could fund a second placement; undersized machines on high-traffic stops trigger stockouts that quietly cap revenue below what the location could support. Inconsistent restocking schedules cause the same effect from the opposite direction — a great location with poor service cadence loses repeat customers who switch to a competing option after one or two failed visits.
Verbal-only placement agreements expose operators to sudden contract termination with no notice period, often after significant capital has already been invested in the installed machine. Failing to track per-machine sales data prevents operators from identifying which stops to expand, renegotiate, or pull — turning route management into guesswork instead of a data-driven operation.
Ready to Build or Expand a Coffee Vending Route?
VMFS USA helps operators source the right coffee vending machines, structure placement agreements, and plan route economics from day one.
Explore Coffee Vending Machines →Frequently Asked Questions
A well-placed coffee vending machine typically generates $300–$1,000 in net profit per month, with high-traffic locations selling 50–80+ cups daily clearing $2,000–$3,500. Profit scales with daily cup volume more than with machine price.
Most operators reach full-time income at 15–25 well-placed machines, assuming average net profit of $400–$600 per machine monthly. That range also marks the typical point where hiring a second route driver becomes worthwhile.
Location commissions typically range from 5% to 25% of gross sales, scaling with expected traffic and negotiating leverage. High-traffic hospitals and large employers can command the top of that range.
Restocking frequency should follow sell-through rate rather than a fixed calendar. High-volume locations may require visits 2–3 times weekly, while lower-volume breakrooms often need only one weekly visit.
Bean-to-cup machines justify their $4,000–$8,000 cost in offices and hotels where premium pricing of $3–$4.50 per cup is achievable. In low-traffic breakrooms under 25 cups daily, simpler instant machines deliver better ROI.
Offices, hospitals, and distribution centers perform best because they combine long dwell time with a repeat, captive population. Coffee is a daily-habit purchase, so locations with the same people returning daily outperform high-traffic but transient retail spots.
Coffee shops carry net margins of roughly 2.5–7% due to rent, equipment financing, and labor costs. Coffee vending eliminates barista wages and storefront rent entirely, which is why per-cup gross margins of 60–80% translate into far higher route-level net profit.
Many operators run both side by side at the same host location, since coffee captures the daily-habit purchase while snack and combo machines capture broader impulse purchases. This combination often increases total per-stop revenue without adding a separate route stop.
Payback typically falls between 12 and 18 months for traditionally placed machines, and as fast as 8–12 months in high-traffic, high-volume locations. Location quality is the single biggest factor affecting payback speed.
A solid placement contract specifies commission rate, contract length, who covers electricity, an exclusivity clause, and a termination notice period of 30–60 days. Written agreements protect operators from sudden, uncompensated machine removal.


Share:
Smart Vending Machines: The 2026 Operator Guide
Coffee Vending Franchise Guide - How to Choose the Right Franchise